
How kite skiing and weighing snow helps improve projections of sea level rise
For the past two years, scientists from the Geological Survey of Denmark and Greenland have skied across the Greenland ice sheet to see how much snow is accumulating. Their data will ultimately improve projections of sea level rise.
On top of 1000 meters of moving ice, in early spring. Minus 15 degrees centigrade. 80 kilometres from the nearest settlement. Number of matches remaining: 74.
Matthias is desperately wasting good matches trying to light the gasoline-powered stove. Luckily for him, we are Swiss, and suppress our anger with politeness. He opens the second of our three boxes, which are supposed to last eight more days.
We are a team of four: Snow physics expert Matthias Jaggi from the WSL Institute for Snow and Avalanche Research SLF, Switzerland, US cameraman Nick Kalisz working for Teton Gravity Research, glaciologist Prof. Jason Box from the Geological Survey of Denmark and Greenland (GEUS), and me, rookie of the group: A postgrad student in atmosphere and climate on an internship at GEUS.
Cooking on the stove, is a mixture of cheese, garlic, starch, gasoline fumes and melted snow, which will become our most special Fondue. Not because we have violated Swiss traditions, which demand a white wine content of around 35 per cent, rather, our meal will be served in the stunning remoteness of the snow-capped south Greenland ice sheet.
The fondue is a well-deserved treat after a successful day sampling snow and traversing the first kilometres of a 40-kilometre journey down the ice sheet using nothing but skis—an alternative for GEUS scientists to the more expensive helicopter.
And in case you were wondering, yes, the fondue did freeze.
The "Q-transect "challenge
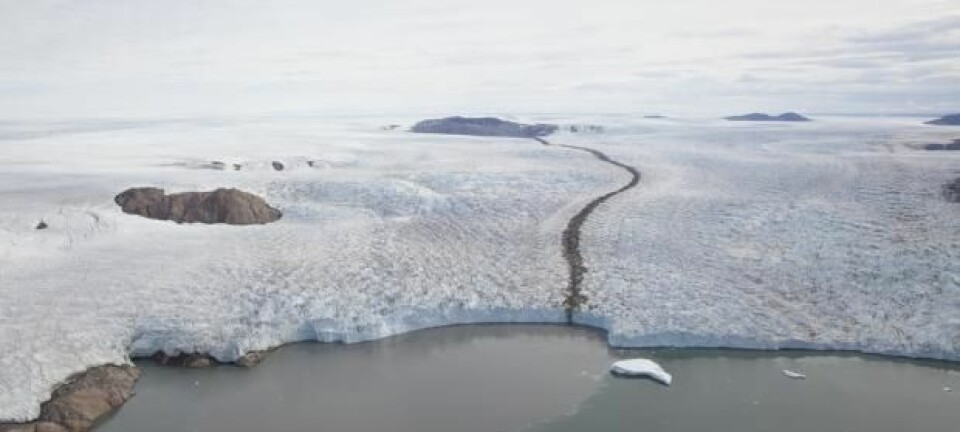
Our mission is to quantify the amount of snow that has accumulated during the past winter on Sermilik Glacier, dumping in the sea at the southern tip of Greenland.
Our skiing will take us from up high on the ice sheet all the way down to the coast for a boat pickup. No helicopter, no skidoos, just us, our equipment, and skis, as we try to reduce the carbon footprint of this type of climate research.
We are following the Q-transect – an invisible line across the ice sheet along which scientists from the PROMICE project have installed and maintained measurements each year since 2009. The main goal is to measure how much ice is either lost or gained each year, depending on how much snow and how much melt there is.
Read More: The mind-bending physics of Scandinavian sea-level change

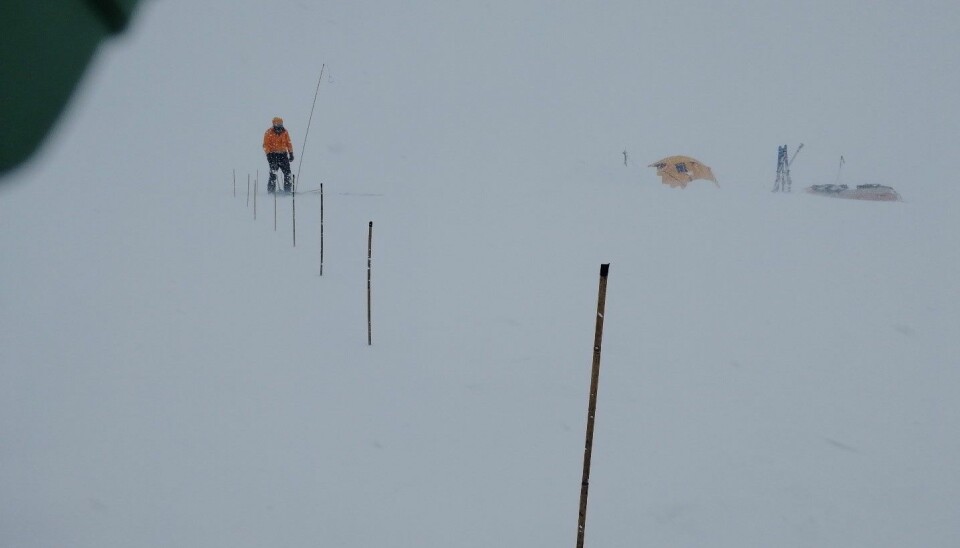
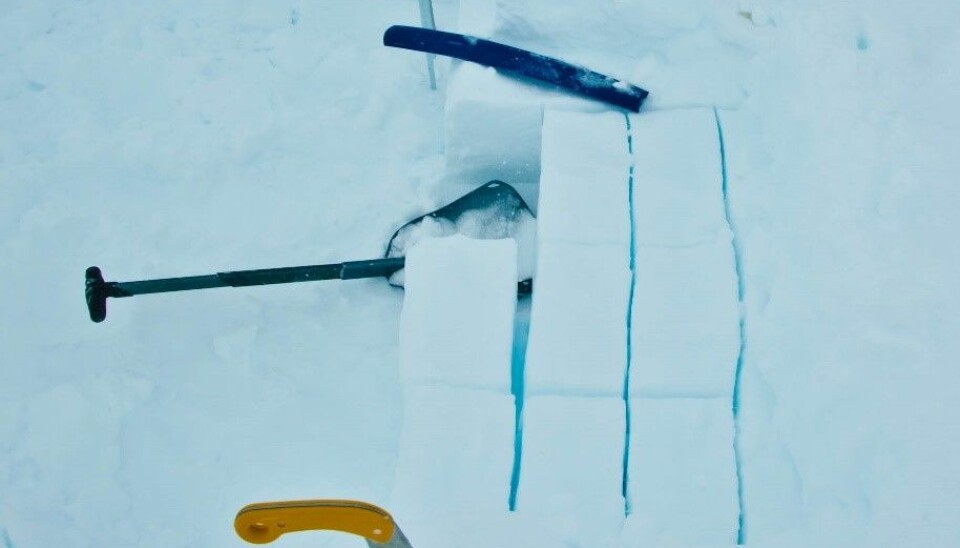
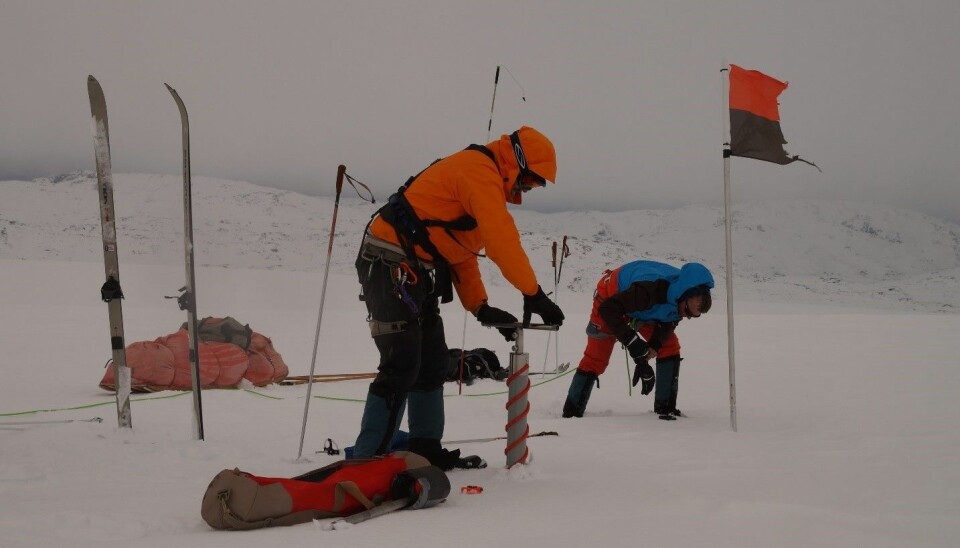
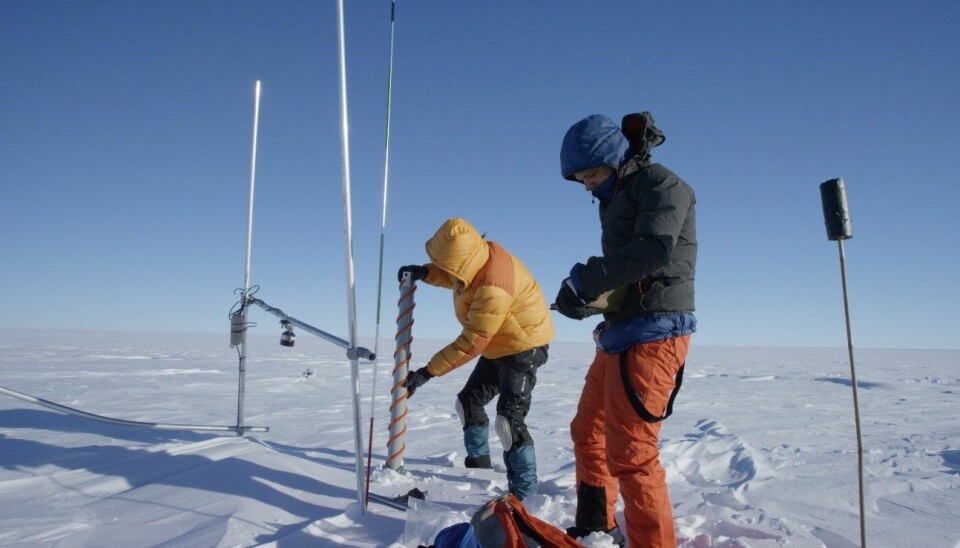
Coring next to a stake assembly of the Q-transect station network. The station records snow height, but we need to measure the weight of the snow to use these data. (Photo: Teton Gravity Research and Geocenter Denmark)
Getting to the bottom of a climate model mystery
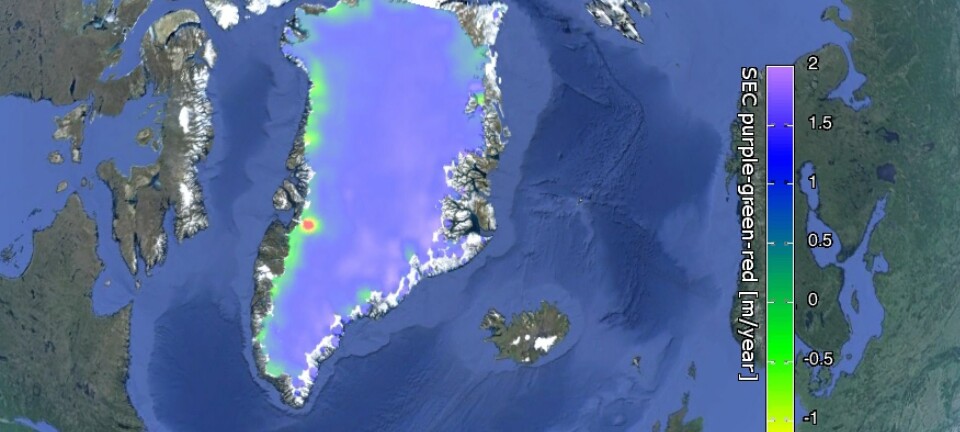
We are trying to get to the bottom of a known problem with climate models for the region: In the area around Sermilik glacier, three regional climate models underestimate the annual net ice melt by more than a factor of two.
In the lower parts of the Q-transect, the ice lost in just one single square metre each year is enough to fill 70 bathtubs. Ultimately, this meltwater ends up in the ocean where it contributes to sea level rise. And in today’s climate, as the amount of ice that the ice sheet gains each year is not able to keep up with the melt, you can quickly see how this poses a problem.
We rely on climate models like these to project future sea level rise. So, to improve these projections we need good estimates of exactly how much ice is gained by snow versus how much is lost by melt each year, the so-called "surface mass balance".
On our trip, our measurements focus the ‘plus’ side of this mass balance--snow accumulation. And so there’s only one thing to do: Get out there and weigh the snow in the layer that accumulates on the solid ice.
We confirmed and put hard numbers on how the climate models overestimate the amount of snow accumulating in winter. This finding was a major part of cracking the melt underestimation problem of climate models. Essentially, the models ‘thought’ that there was more snow during winter than there actually was and this meant that at the end of the glacier year (around October) the modelled ice sheet contained too much ice. Due to glacial physics, the knock on effect of this in a model is to under predict the amount of ice lost each year.
Our results now appear in the Journal of Geophysical Research: Earth Surface.
Let the rain begin
But let’s return to how we collected the data, as out on the ice sheet, things did not exactly go to plan.
Day three of expedition Q17 (as in “Q”-transect, 20”17”), and Jason approaches us after his regular satellite phone call with the meteorological office.
It is bad news. They are forecasting wind gusts of more than 100 kilometres an hour, and worse: Rain.
The most important aspect of our ski traverse is safety, and rain is a threat as it penetrates and destabilizes the snow, which is all that separates us from the crevasses below.
Our choice is clear, we now have to reach the coast before the storm, reducing the remaining planned five days of the trip into a single day.
We are motivated to go as fast as we can despite the 60 kilogram loads on each of our sleds. On the plus side: Fewer days means we’re not so worried about running out of matches!
Read More: Sea level rise: How far and how fast?
Highs and lows of Q17
After 13 hours of walking, pulling, drilling, and some more pulling, we reach land.
We ran out of drinking water a few hours earlier, ironically enough, given that were are on a glacier losing about 1,300,000,000 tons of the stuff every year.
Jason had arranged for a boat to collect us that evening. The tough Greenlandic fisherman drove two hours to the remote bay just for us. But then came the greatest disappointment of the entire trip: The bad weather made landing the boat impossible.
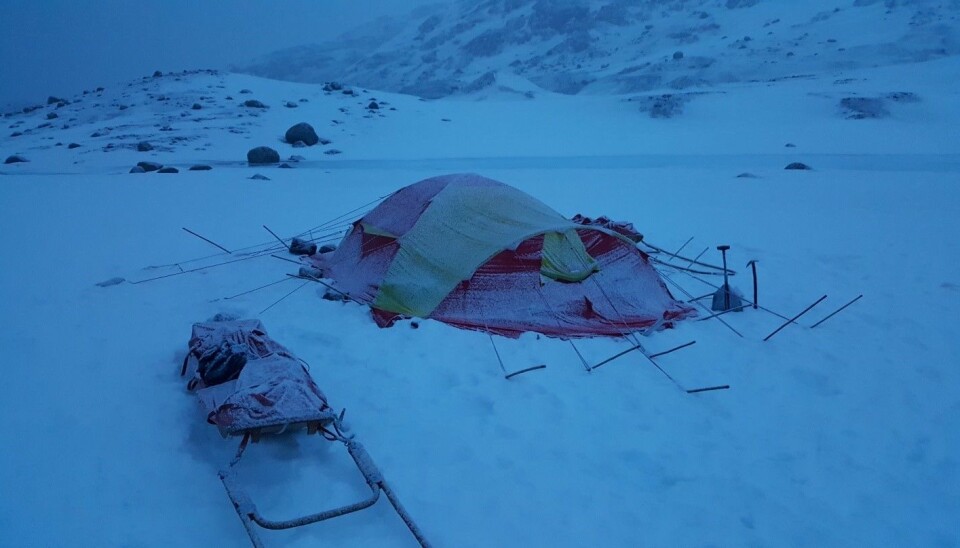
So, we made camp and spent two more nights at the coast, in the rain. One night, I added fear to the long list of feelings for the trip. The time that the rain was forecasted to end had passed, but it was still pouring. I started thinking about everything that could go wrong during bad weather, in a tent, at a coast where probably no one else had ever stayed before, with limited resources.
But retrospectively, I would say: What could be better?
Read More: Take a tour of an Arctic monitoring site

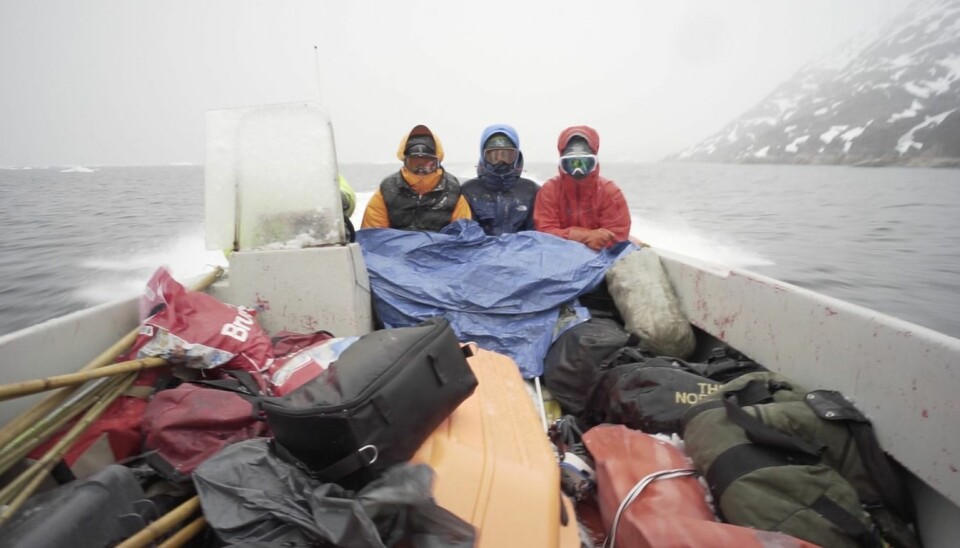
Jason, me and Matthias (from left to right) experiencing the coldest hour of our trip, rushing through the fjords with >30 knots. (Photo: Teton Gravity Research and Geocenter Denmark)
The work continues
Our time on the ice was cut short and we had only four full days, instead of nine as planned. Still, we were able to collect snow accumulation data at all nine Q-transect sites. After some necessary field data reduction, we were ultimately able to figure out why the climate models were not able to accurately predict the mass balance of this part of the Greenland ice sheet.
On top of that, Nick had shot some amazing video footage resulting in a mini climate documentary, which you can see below.
Expedition Q17 was the first time that GEUS had made a ski traverse along the Q-transect. And key to our success was careful planning, the ability to adapt in the field, and teamwork. And one year later, in 2018, we actually set off to do it all again.
Read More: Climate scientists build laboratory under the ice with a balloon
Q18: Kites away!
Four months ago already, Jason and I made the Q18 traverse, an extended version of the traverse in terms of distance, time, and equipment. I was delighted to be invited for this tour, among other things, because of our chosen mode of transportation: Kites!
We first assisted GEUS colleges in nearby Camp Recovery, looking for Airbus A380 engine parts following engine failure over the Greenland ice. Connecting the two field campaigns was a big logistical relief for the search team, but it meant an additional 60 kilometres for us – the main reason for snow kiting.
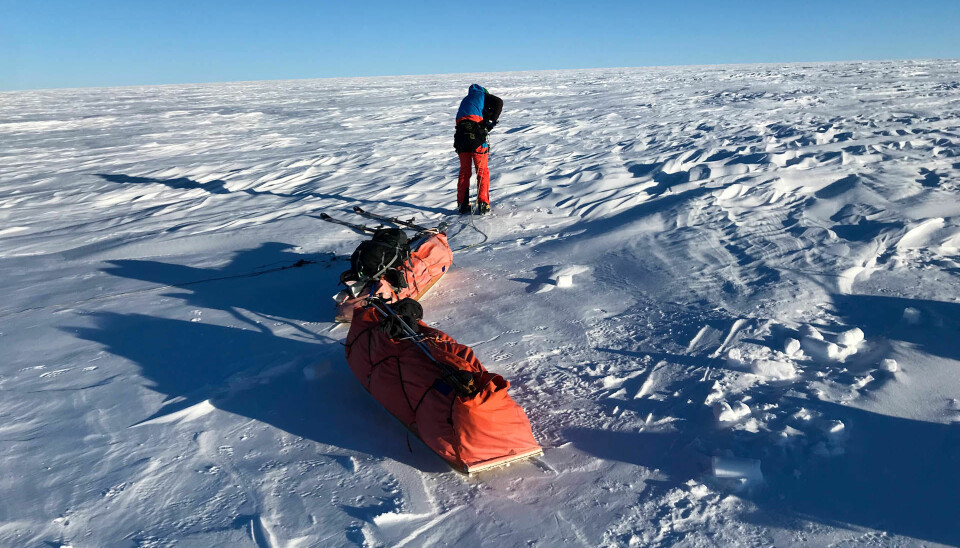
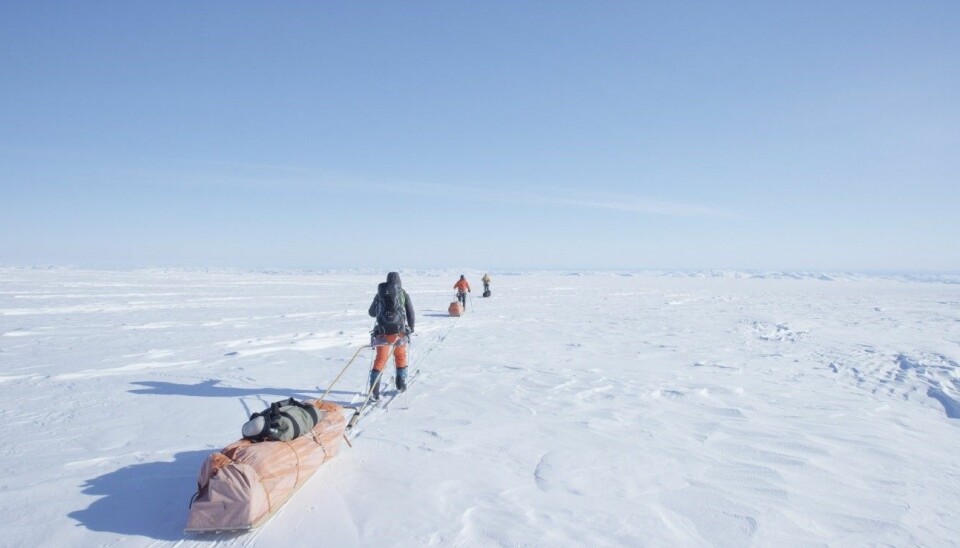
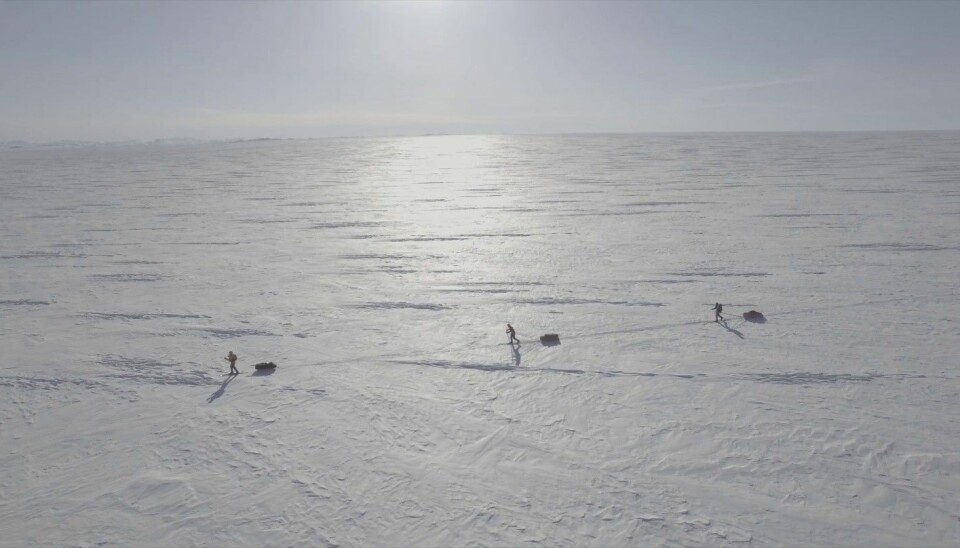
We relied on wind to pull us and our equipment, which was loaded onto two sleds.
Despite bruises and lost toenails, gliding across the largest body of ice in the Northern Hemisphere while seeing peaks on the horizon and their mirror image in the sky due to reflection at the top of the cold atmospheric boundary layer, was incredible.
Read More: Q&A: What is it like to be a scientist in Greenland?

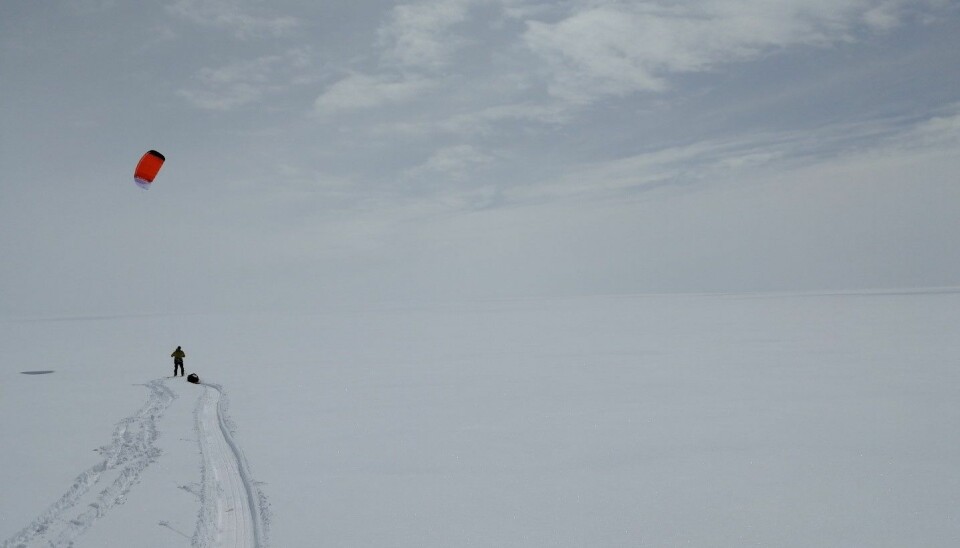
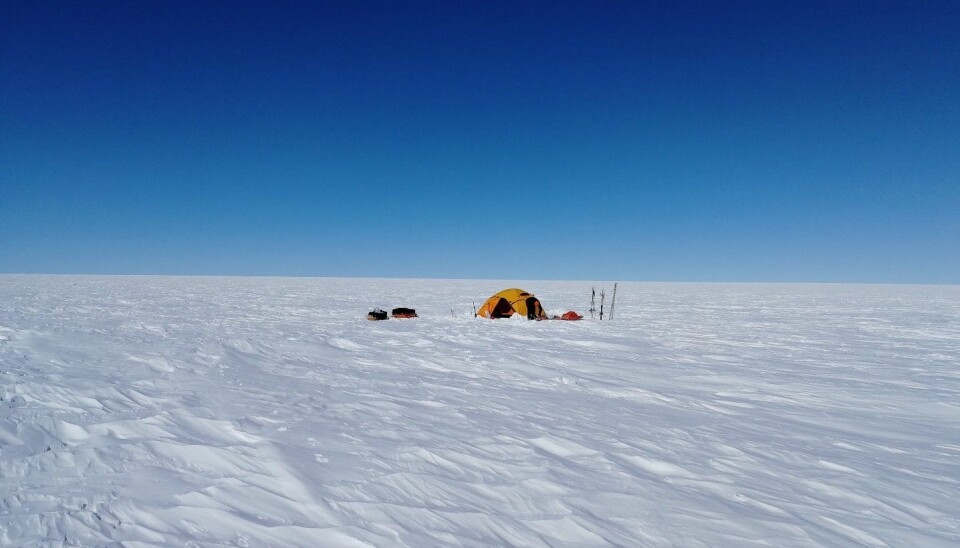
Kiting after the storm in fresh powder. (Photo: Mauro Hermann)
Painstaking but crucial work
We got up earlier and earlier each morning, finding that 3:30am was best to kite ski during the strongest winds. Just warming up the stove and boiling water took more than one hour. Then we dressed, dug out and tore down the camp, and (carefully!) loaded our sleds.
We 'hit the road' around 6.30am, when daily katabatic winds, conveniently blowing from behind, peaked. But once used to it, the time didn’t really matter. The sun rose early and so did we.
Our third team member did not join, having gained nothing but bruises during our quick introduction course in kiting before the trip.
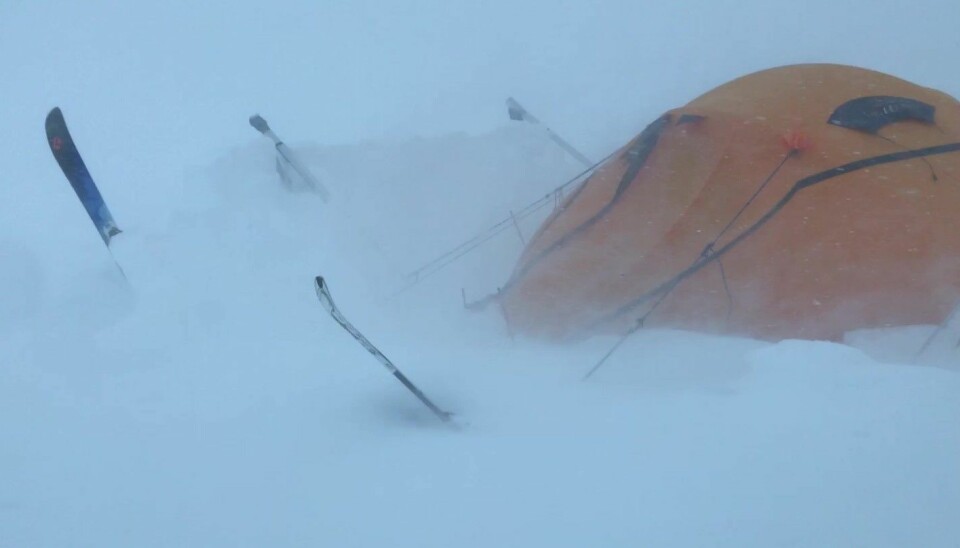
We also lost more than 48 hours while pinned down by a storm with average wind speed of 100 kilometres an hour. The wind blew snow drift into our awning, freezing onto our gear and prolonging the time needed to warm up the stove.
Eventually, the storm cleared and revealed 40 centimetres of fresh snow. Beautiful, but warm and sticking to the bases of our skis and sleds. We started walking and pulling our now 80 kilogram sleds as the wind direction was not favourable. Exhausted, we launched the kites and were able to pick up speed, although they took us off course. Fieldwork never goes quite as planned!
So, the next time you read about a new climate change study in the Arctic, remember, climate models are great, but they rely on field data to be checked. That’s the life of a glaciologist: In our polyester tent in the middle of nowhere, with weird fondue, doing the painstaking but crucial, and absolutely unforgettable, work of verifying these data in the field.
---------------
Read this article in Danish at ForskerZonen, part of Videnskab.dk (Coming soon...)