Sea level rise: How far and how fast?
OPINION: A recent study of ocean temperature 125,000 years ago sparked headlines that up to nine metres sea level rise was on the horizon. But could this really happen? And if so, how quickly?
A paper appeared in Science this week about sea level rise in the last interglacial (about 129-116,000 years ago).
It has sparked the usual predictable headlines as it points out that during that period, sea level rose by about six to nine metres but that the ocean temperatures as far as they can be reconstructed, are similar to those what we observe now, that is about 0.5 degrees Celsius warmer than the pre-industrial.
In a sense this isn't that "new"—we've known about higher sea levels during the last interglacial for ages and that the global mean temperature was roughly 2 degrees Celsius above the pre-industrial global mean.
This is in fact one of the reasons that 2 degrees Celsius above the pre-industrial global mean temperature was set as the target for limiting greenhouse gas emissions in the Paris Agreement (though some scientists speculate that it’s also pretty much already out of reach).
However, the sea surface temperatures reported in the paper makes it extra interesting as the ocean is a pretty big source of uncertainty in global climate models and most global models do not currently manage to reproduce modern day ocean temperatures all that well, though regional models run at higher resolution do manage to give some impressive results.
Recent results published by our colleagues at DMI and the University of Copenhagen, Denmark, Rasmus Pedersen, Peter Langen, and Bo Vinther for this period in the last interglacial are from one of the very few global climate models that can reproduce the kind of temperatures that this new paper suggests are realistic based on ocean sediment cores.
Read More: Climate models underestimate rapid ice melt events on Greenland
A good analogue for future climate—to a point
It should also be said that the last interglacial is only a good analogue for a “+2 degrees Celsius” world up to a point.
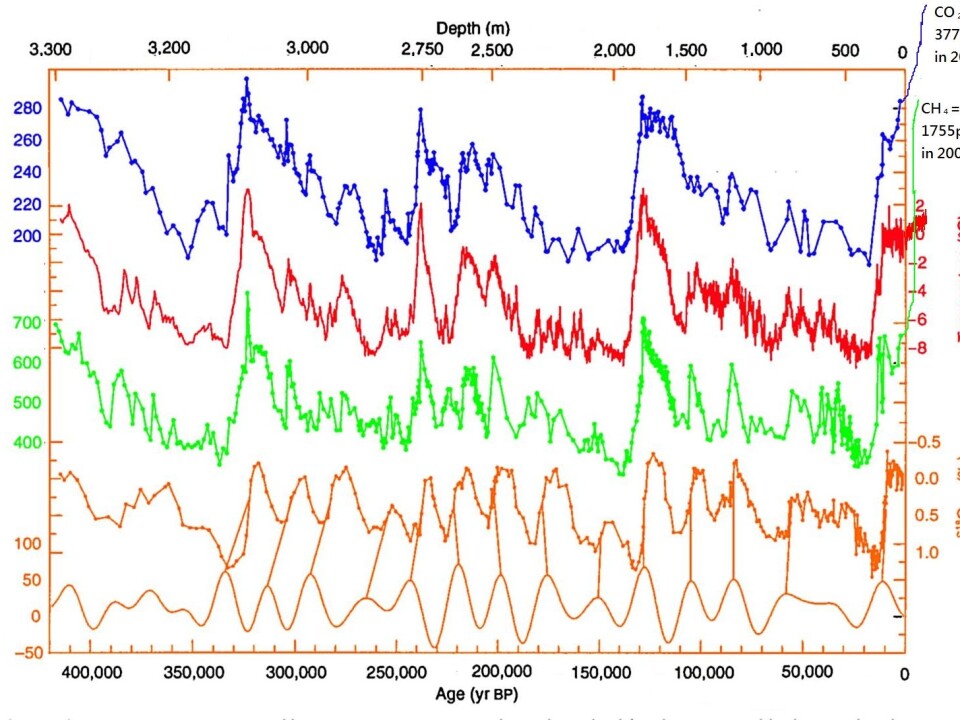
This period of time was warm because of enhanced solar input during summer, particularly in the northern hemisphere, because the earth axis was tilted at a different angle towards the sun than today, not because of greenhouse gases, as this plot from an Antarctic ice core, edited by glaciologist Bethan Davies at the Antarctic Glaciers blog, shows.
The key questions from this paper that we should now consider are how fast did sea levels respond the warming temperatures and where did the water come from?
Read More: Arctic sea ice is approaching the limit of natural variability
Greenland ice sheet does not have all the answers
The Greenland ice sheet was much smaller than today but it was still there as shown by ice core records of past climate change from Greenland, for example, NEEM and RECAP.
Today, Greenland "only" contains around 6.5 to 7 metres of sea level rise, so the complete disappearance of all glaciers in Greenland cannot explain the rise in global sea level.
The small glaciers and ice caps of the world can't contribute more than half a metre or so to global sea level rise either. Therefore, Antarctica has to also be contributing significantly--East or West is the question and it really is a very, very long-standing question.
Read More: Greenland Ice Sheet has already caused nearly five metres sea-level rise
The big question: how stable are the Antarctic ice sheets?
The progress in the international polar year (IPY) in mapping the bedrock of Antarctic in the BEDMAP2 brought quite a few surprises, including the discovery of several very deep marine basins in the East.
These could contribute a lot of water to sea level if the grounded land ice here is released into the ocean.
More recently, channels under the floating ice shelves of west Antarctica, along with various modelling studies have proposed that the west could be much more unstable than previously thought as well.
The question of the stability or otherwise of Antarctica has been considered in Antarctic science since at least the late 1970s when John Mercer first proposed the marine ice sheet instability hypothesis (see Fact Box).
In either case, events in both Denmark and the UK have brought this problem home to all of us much more sharply.
Read More: “Irreversible” glacier retreat in West Antarctica began 70 years ago
Sea level rise impacts in UK and Denmark
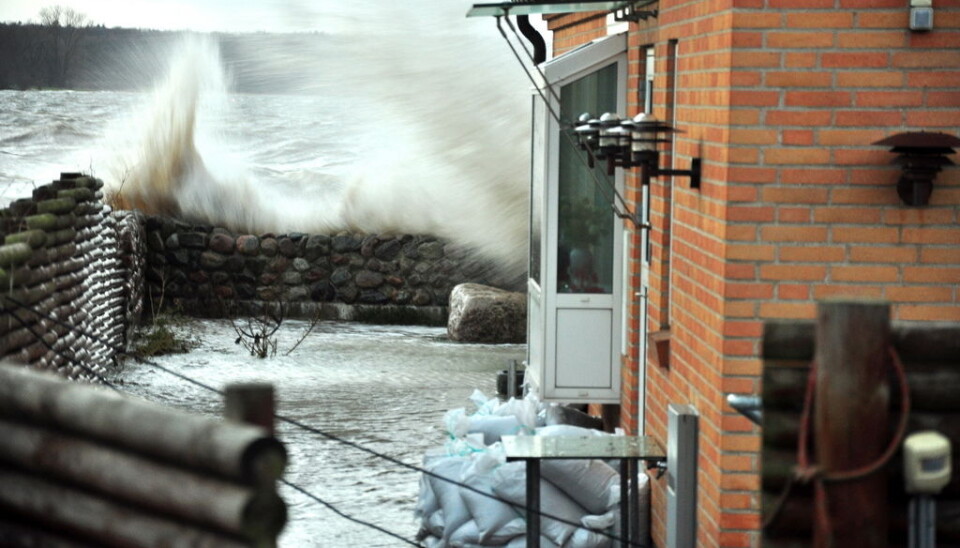
The "silent storm surge" in January 2017 around the coast of Denmark was a hundred year event in many places, but as Aslak Grinsted (sea level expert at Niels Bohr Institute, Denmark) points out in this tweet, sea level rise makes a hundred year event into a 20 year event with only a small rise in sea level, a rise that has been observed around Denmark.
Sea level in Gedser, DK has risen by ~20cm since 1900. That is the difference between a 20year and a 100year storm surge in official stats. pic.twitter.com/zXDRLGLT8z
— Aslak Grinsted (@AGrinsted) January 4, 2017
Sea level will not rise equally everywhere, the fingerprint of Greenland ice sheet loss is felt largely in the Pacific, Antarctic ice melt will be mostly felt in Europe.
It matters where the water comes from. A point not generally appreciated and why we are so concerned with it.
Read More: Time is running out to adapt to dramatic sea level rise
Need better estimates of ice sheet retreat
So this new paper is also important, but it only underlines that we need to be able to make much better estimates of how fast and how far the ice sheets will retreat, which is the point of much of our own scientific research, including in the ice2ice project.
Here we are looking at archives of temperature data from the past, from ice cores and ocean sediment cores in much the same way as in the new paper.
However, we are focusing on abrupt climate changes, increases of as much as 15 degrees Celsius around Greenland in perhaps only a decade that occurred repeatedly during the last glacial period, so-called Dansgaard-Oeschger cycles.
We are seeking to understand both the causes of these changes and the implications for the ice sheets in order to assess if these can occur in the future.
Read More: COP21: What does two degrees Celsius global warming look like?
Sea level is already rising
Finally, it's probably necessary to point out that sea level is already rising.
We have been surprised to be asked a number of times, by interested members of the public if sea level rise can be measured. In fact we can measure sea level rise pretty well with both satellites and records from tide gauges.
The global warming signal is already detected in the ocean because the upper ocean expands as it warms and three quarters of the globe is covered by oceans. The ocean will continue to expand further, even if we halt all greenhouse gas emissions as the warming penetrates down into the deep ocean.
Clearly, scientists like us are *still* not doing a very good job of communicating our science more widely, so we’ve plotted here the global mean sea level record to date. It's updated pretty regularly here and on average, sea level is rising at about three millimetres each year or three centimetres per decade, though there are occasional short falls related to for example, widespread flooding in Australia in 2011.
There are also significant regional variations, even in Denmark. For example, land in Scandinavia, including north Denmark, is still rising after the retreat of the ice sheet that once covered it; the Earth’s crust is bouncing back after the release of that load and this rise is just about keeping pace with observed sea level rise, at least for now.
Southern Denmark however does not have this advantage and has seen a sea level rise of about 20 centimetres in the last hundred years. Overall, when we look at tidal gauge records, sea level rose about 20 centimetres in the twentieth century.
The big uncertainties we have on whether or not this will accelerate in years to come is largely down to missing processes in ice sheet models that we don't yet understand or model well--mostly calving by glaciers and ice shelves.
There is also a great deal of uncertainty in how much our emissions of greenhouse gases will continue in the next decades, and how temperatures at the poles will evolve.
European Environment Agency predicts higher sea level
While the IPCC 5th Assessment Report suggested that in the twenty-first century the likely sea level rise will be on the order of half a metre, a new report from the European Environment Agency (EEA) about climate change impacts and adaptation in Europe states that some national and expert assessments suggest an upper bound of 1.5 – 2 metres this century, for high greenhouse gas emissions scenarios.
This is a big difference and would be pretty challenging to adapt to in low-lying countries like the Netherlands and Denmark, not to mention big coastal cities like London or Hamburg.
It's also important to emphasise that it doesn’t just stop at the end of the century, in fact our simulations of the retreat of the Greenland ice sheet suggest it's only just getting going at the end of this century and the next century the rate of ice loss will really start to accelerate.
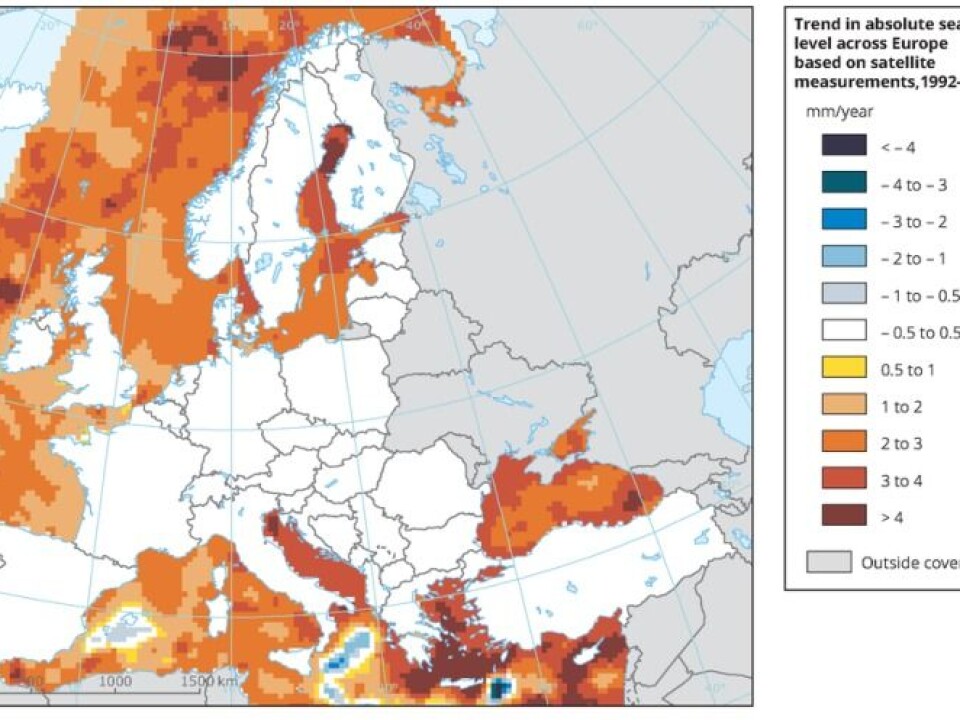
The EEA has also produced a map of observed sea level rise in Europe over the last two decades based on Copernicus environmental monitoring data.
With the prospect of American federal funding for environmental observations being reduced or strongly constrained in the future, it’s really important we start to identify and support the European datasets which are the only other sources of environmental monitoring out there right now.
All of which is to say, there’s really a very good reason to act now to reduce our emissions.
There is still much work to do.
---------------
This article originally appeared as a blog by Ruth Mottram on "Sterna Paradisaea: Arctic, climate, science, nature." Read the original article here.
