Explore 200 years of climate change in Denmark, Greenland, and the Faeroes
DATA: Each year DMI updates their historical collection of climate data, which is available to download free. Here are some of the highlights.
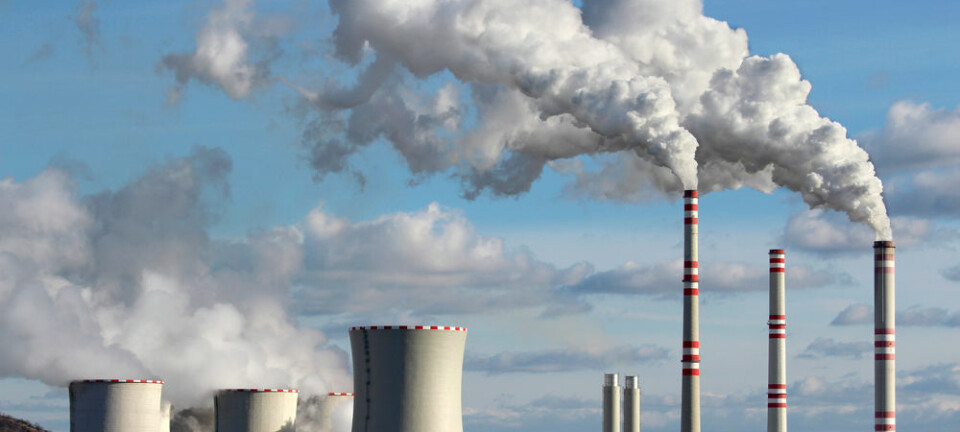
Record breaking heat waves, severe hurricanes, forest fires, and floods. The weather made the headlines right across the world in 2018.
Here in Denmark we maintain records of the weather dating back to even before the foundation of the Danish Meteorological Institute (DMI) in 1872. We also monitor weather across Greenland and the Faeroe Islands.
These long records give climate scientists vital insights into how unusual or normal recent events are when compared with the longer term trends in climate.
After all, we need to know how the climate changes in general to figure out how much of this change is driven by us humans.

This is one of the reasons why collections of old weather data are so valuable.
Every year, DMI publishes historic climate data for Denmark, Greenland, and the Faeroe Islands, which are freely available to download from the DMI website. This means that anyone can now access climate data from these Nordic countries.
This article gives a glimpse into these long, high quality climate data series. You can explore the data yourself in our interactive graphic below. And if you want to explore more data from DMI you can find a long list of sources at the end of this article.
Explore Nordic climate data in our interactive graphic above. Problems viewing the graphic? Click here to view in a new browser window. (Graphic: ScienceNordic and ForskerZonen)
Long temperature series shows a clear trend: We’re getting warmer
Denmark and Greenland have some of the longest published temperature data series in the world, dating back to 1768 and 1784, respectively. While in the Faroe Islands we have data from 1873.

Unsurprisingly, these Nordic countries have very different climates and so the data at first glance appear rather different.
Denmark sits at the edge of the European continent where we have a number of long temperature series from sites across the country. While the Faeroe Islands, are located in the North Atlantic Ocean, in the path of the warm North Atlantic current.
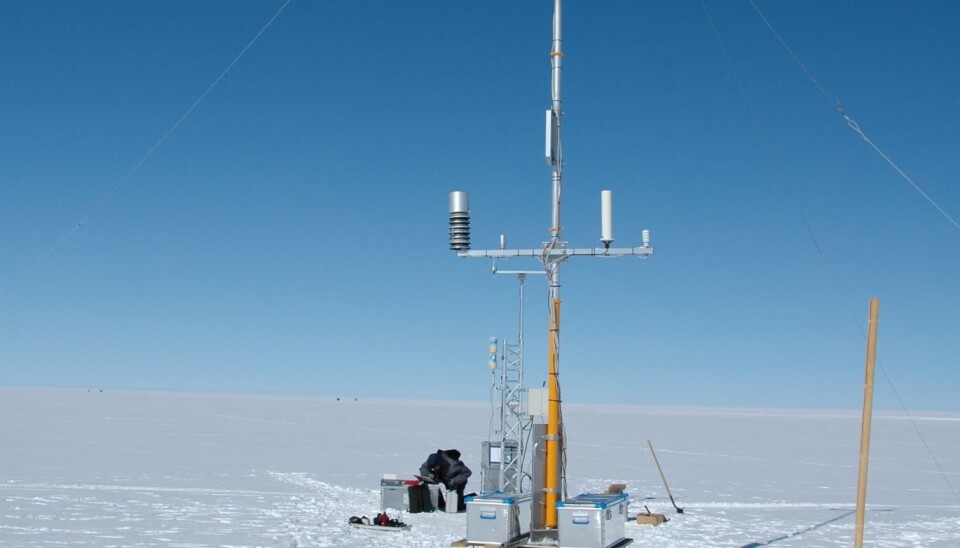
In Greenland, most weather stations are located in the coastal regions, at the margins of the ice sheet. Greenland is the world’s largest island, covering 2.2 million square metres and straddling 24 degrees of latitude. Eighty per cent of it is covered by the protruding Greenland ice sheet, which makes this area particularly interesting for climate scientists as this is where we can see some of the biggest changes in climate.
And yet despite their wildly different locations, geography, and climate, all three countries show the same overall trend: warming.
Temperature has risen markedly in the Nordics in recent years. And, as in many other places around the world, the current temperatures are among the highest in the series. The general warm weather that we experienced in 2018 in Denmark with a record breaking warm May and summer will generate another warm year in the record.
Read More: More extreme warm days in a warmer climate
Denmark is getting wetter
DMI has measured the amount of sunshine hours and precipitation (rainfall, snow, hail, and so on) since the 19th century.
The oldest published measurements of precipitation in Denmark are found in Copenhagen, where it has been measured since 1821. Similar data from Greenland and the Faeroes are available from 1890.
Precipitation has increased almost everywhere in Denmark. This makes sense, since a warmer atmosphere can hold more water.
But the same trend is not so clear cut in the Faroes and Greenland. This is not so surprising, since these records cover a much larger and more varied geographical area.
The oldest published sunshine data are also found in Copenhagen, from 1876. And we also have data from the Faeroes from 1922. The trend in Copenhagen and in Tórshavn seems to be towards more hours of sunshine in the latter part of the records.
Unfortunately we don’t have any sunshine data from Greenland. In Greenland we take observations of radiation (in watts/ per square metre), but we do not have any suitable way to convert these data to sunshine hours.
Read More: New report: how the Arctic will look in 30 years
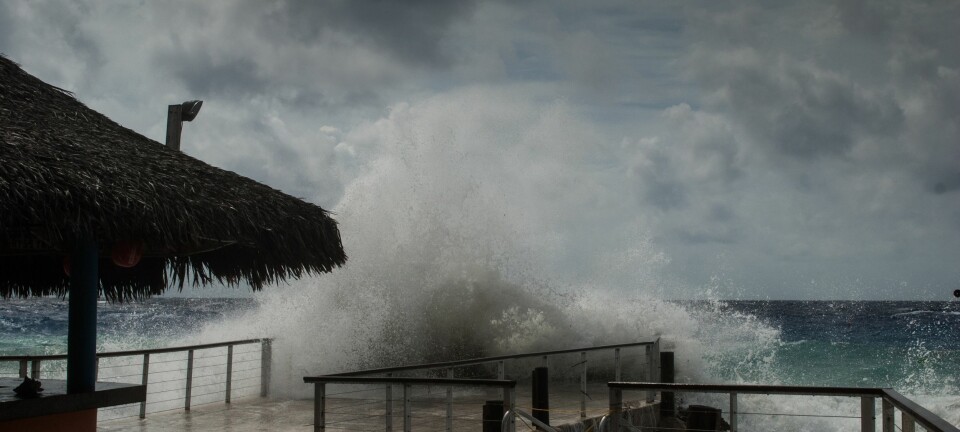
Wind, pressure, and stormy weather
In Denmark we are lucky to have long records of atmospheric pressure all the way back to the 1870s.
This is important, as we can use pressure data to calculate other, less well documented parameters, such as wind strength. It is only in recent decades that we have developed accurate instruments to record wind. Previously, measurements were often based on subjective estimates, making it difficult to compile a long history of wind strength, in the same way as we can for temperature or rainfall.
Studies that use pressure data to estimate changes in wind strength in Denmark show some variations from the mid-1800s to today, but they do not show any particularly strong long-term trends.
These data are supplemented by records of hurricanes or strong storms, which are available from 1891. Here, all storms to hit Denmark are classified using the same method. These combined data suggest that the windiest weather in Denmark occurred at the start and end of the 20th century. And that milder conditions occurred between the 1930s and 60s, and the first decade of the new millennium.
The picture recently changed with the occurrence of three hurricane-strength storms in 2013 and 2015. There have been a number of stormy situations in Denmark, in 2016, 2017, and 2018, but none of these are considered strong storms or hurricanes.
Read More: Heavy summer rain in Greenland speeds up ice melt
How do we know that such old data are reliable?
You might be wondering how data collected in the 1700s can be compared with data collected in 2018?
In Denmark, the oldest measurements date back as early as 1751, but we don’t use these very early data because of strict requirements for data quality.
To figure out which data are reliable we need to know the full history of the weather station in question and the instruments used to collect the data. For example, was the station moved to another location or did the surroundings change over time? A common occurrence as cities expand. We need to know if the instruments were updated, or if the operator changed the time at which they took measurements.
All of these events alter the data collected at a weather station. But so long as they are recorded, we can correct the data to take these changes into account. This way, we are sure that any trends are not caused by, for example, a change of instrument or surroundings, but reflect a real change in the data over time. Only then can we compare data collected over long periods of time, using different technology, and from different weather stations.
Read More: Here’s what a warmer world will look like in Norway
Quality control is a top priority
These requirements allow us to compare data from one station to another, in the Nordics or anywhere else in the world, so long as they all meet the same high standards of quality control.
And it’s not just temperature data that are carefully corrected in this way. We face the same challenge with precipitation and sunshine data, whereby the instruments used to take measurements and the location of weather stations have changed over time.
To make sure that the data are accurate and reliable we go through the same rigorous quality control procedures. It is a lot of work, but it means that we can reliably combine data from different instruments and weather stations into a single long-term record and compare data collected over long periods of time.
Read More: How kite skiing and weighing snow helps improve projections of sea level rise
A unique collection of historical climate data
Maintaining and developing the historical instrumental climate data for Denmark, Greenland, and the Faeroes are important tasks.
The collections are unique in more ways than one. Not only do they represent a piece of national history for the Kingdom of Denmark, they also include data from a unique region of the world, Greenland, which help us to better understand global climate.
This is why climate scientists at DMI and all around the world put such much effort into collecting old data and making sure that what we publish is reliable and accurate, and reflects the true variation of climate through time.
If you would like to explore these data further, you can find everything you need at DMI’s website. All of the data are freely available, and we update our long data series each year.
---------------
Read this article in Danish at ForskerZonen, part of Videnskab.dk
Translated by: Catherine Jex
Scientific links
- DMI publications and climate reports
- DMI Report 18-10 Guide to Climate Data and Information from the Danish Meteorological Institute Denmark, Greenland and The Faroe Islands Updated May 2018. John Cappelen (ed)
- DMI Report 18-02 Denmark - DMI Historical Climate Data Collection 1768-2017. John Cappelen (ed)
- DMI Report 18-04 Greenland - DMI Historical Climate Data Collection 1784-2017. John Cappelen (ed)
- DMI Report 18-05 The Faroe Islands - DMI Historical Climate Data Collection 1873-2017. John Cappelen (ed)
- STORMS IN DENMARK SINCE 1891