How the Greenland ice sheet fared in 2017
Scientists from the Danish Meteorological Institute and Polar Portal give the Greenland ice sheet its annual health report.
September saw the end of the Greenland ice sheet melt season. This marks the traditional point of the year where scientists look back at the past 12 months and see how the ice sheet is faring.
Overall, initial figures suggest that Greenland may have gained a small amount of ice over the 2016-17 year. If confirmed, this would mark a one-year blip in the long-term trend of year-on-year declines over recent decades.
The unusual year is mainly down to heavy snow and rain in winter and a relatively short and intermittent summer melt season. And the source of that bumper winter snowfall was the remnants of a hurricane that wreaked widespread damage 4,500km away in Bermuda.
Read More: How the Greenland ice sheet fared in 2016
Surface ice changes
Each year, Greenland’s glaciers gain ice from snow and freezing rain and lose ice through melting. Taken together, these elements give the surface mass budget (SMB) for the whole ice sheet. Typically, Greenland gains ice mass on its surface from around September to May and then loses ice in the “ablation” season of June, July and August.
“Ablation” refers to when ice melts and runs off the ice sheet into the ocean (rather than when meltwater stays put and refreezes).
At DMI, we use a weather forecasting model to calculate how much Greenland ice is gained and lost every day. Totalled over the course of a year, from 1 September to 31 August, this gives us the “annual surface mass budget”, which provides something like a health check for the ice sheet.
Read More: Industrial pollutants are changing the microbiota of the Greenland ice
For the 2016-17 SMB year, which ended on 30th August, the ice sheet had gained 544bn tonnes of ice, compared to an average for 1981-2010 of 368bn tonnes.
(Note, the SMB doesn’t take into account the breaking off, or “calving” of icebergs from the ice sheet’s edge, which we’ll come to later. Calving losses have averaged around 500bn tonnes of ice per year this century. This means the ice sheet has been losing mass overall across recent years.)
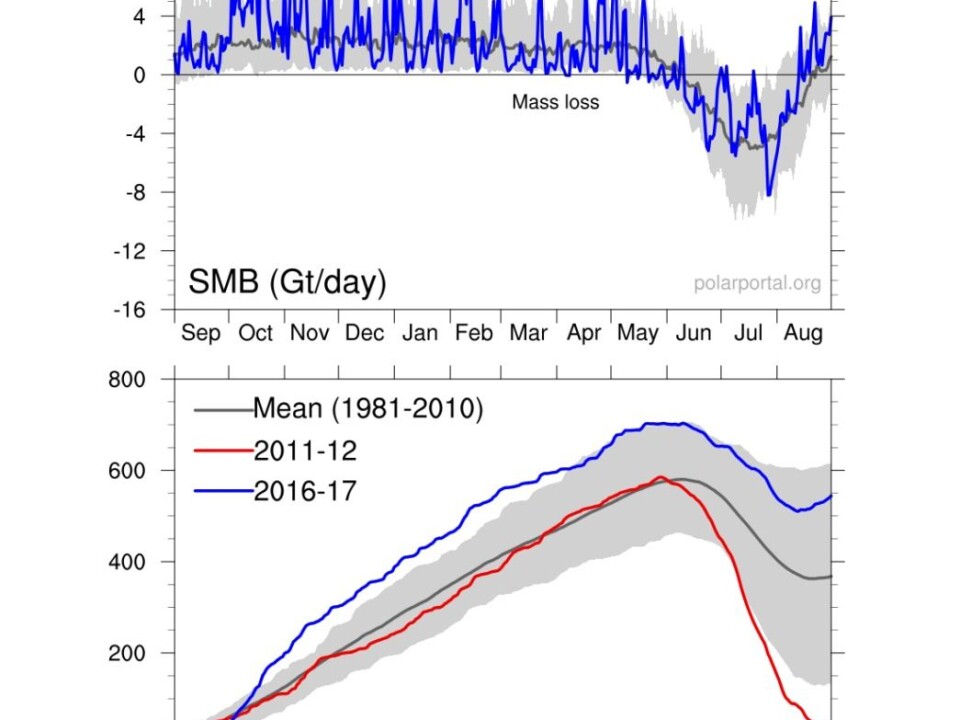
You can see how the year has panned out in the charts below. The upper chart shows the daily ice gain/loss for 2016-17, with the gain from September to May, and the losses during the summer melt season.
The lower chart shows these daily figures cumulatively over the course of 2016-17 (blue line), with the 1981-2010 average (grey) and the record low SMB of 2011-12 (red) for comparison.
Overall, the end of year SMB is high when compared to the 2000s and the 1990s, and more akin to what we saw in the mid-1980s. The SMB for 2016-17 is the fifth highest in the 37-year record – the highest was the 619bn tonnes gained in 1995-96.
Read More: Predicting the next big flood in Greenland
Hurricane Nicole
So, what has contributed to the relatively high SMB this year?
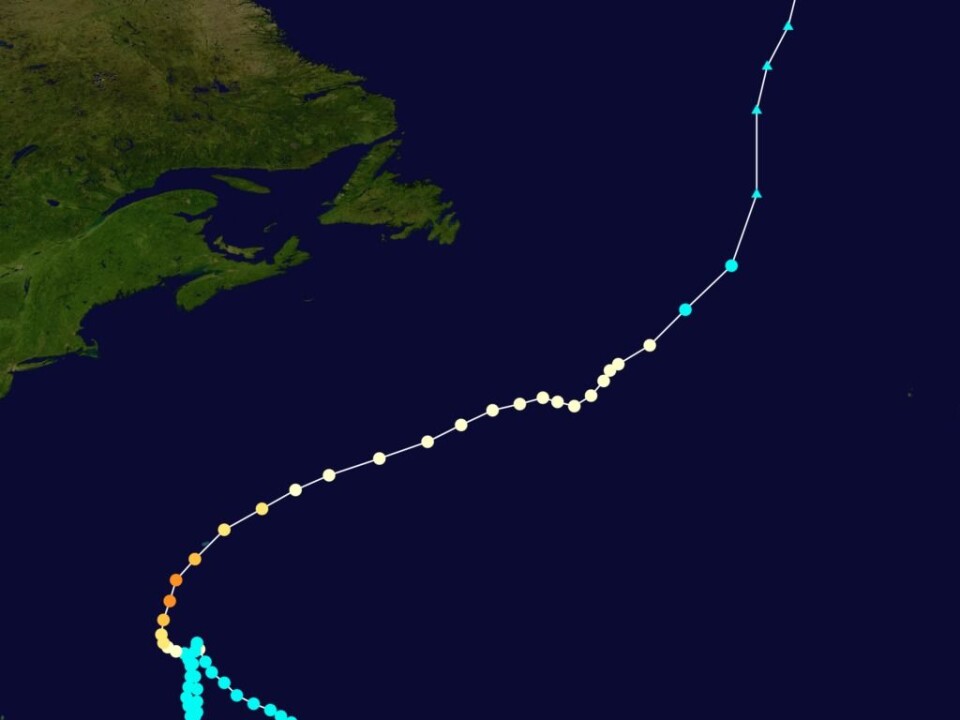
The main culprit was Hurricane Nicole, one of the longest-lived named Atlantic storms of last year. Hurricane Nicole grazed (officially, it did not “make landfall”) the island of Bermuda as a category 3 storm in October, causing widespread damage and knocking out power to most homes and businesses.
It then veered northwards through the Atlantic Ocean, morphing into “Post-Tropical Cyclone Nicole” and then becoming a “vigorous extratropical storm” as it moved from the tropics into the cold North Atlantic.
You can see the path that the storm tracked in the image above.
Read More: New Book: Ice-free Greenland in photos and science
In a similar way to Hurricane Harvey, Nicole then got lodged over eastern Greenland for some days. The storm dumped heavy rain and snow on Greenland – hitting record totals of precipitation in the main east coast town of Tasiilaq.
You can see the effect this had on the SMB in the earlier charts – note the peaks in October on both the daily and cumulative graphs.
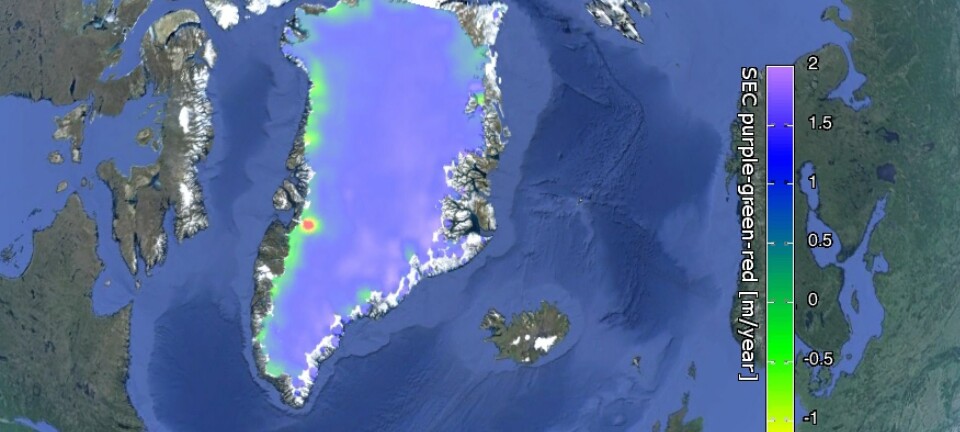
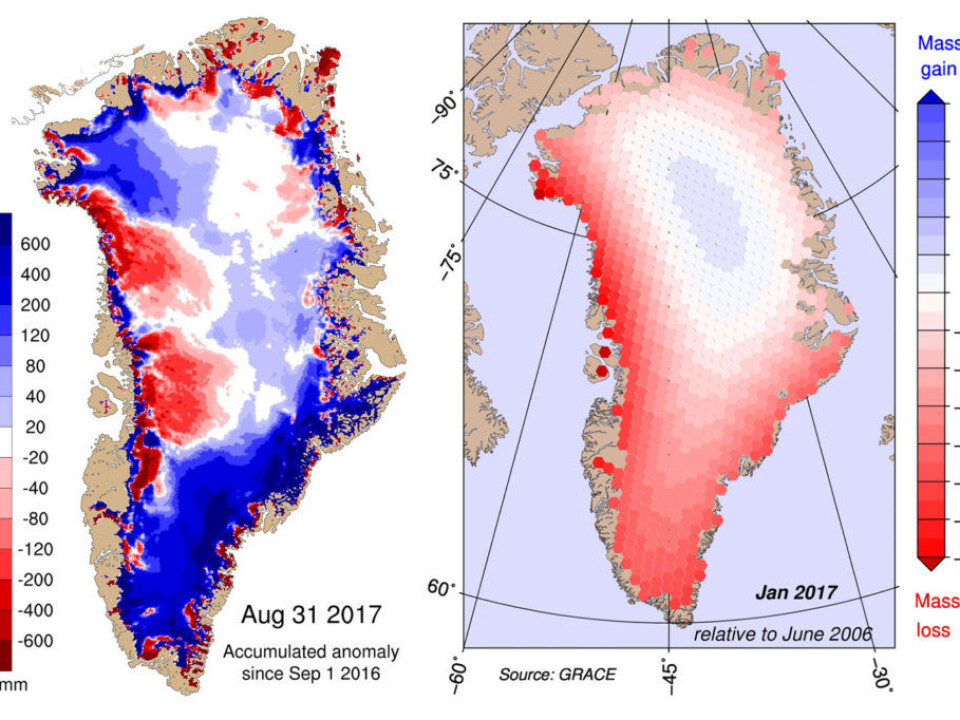
The rest of the winter was then fairly average in terms of the amount of snow that fell. Indeed, parts of north western Greenland had less snow than usual – as indicated by the red shading in the accumulated SMB anomaly (left-hand) map below. The right-hand map shows the total change in ice mass over Greenland between June 2006 and January 2017.
Read More: Greenland’s beautiful wildlife in pictures
Record highs and lows
Another important process to consider for the Greenland ice sheet’s overall health is the ablation season, which has been relatively short and below average this year.
We define the start of the ablation season as the first three days in a row where the ice sheet loses more than 1bn tonnes of ice through melting. The date of onset in 2016-17 was near-average, but high rates of ice loss were delayed by a cool start to the summer, with fresh snowfall in early June.
Going into summer with a large amount of accumulated fresh snow means that the albedo feedback takes longer to kick in. Albedo – a measure of how much of the sun’s energy is reflected away from the surface – is a very important factor for the rate of glacier ice melt. Fresh snow is bright and reflective and slower to melt, but when the older and darker snow and glacier ice is exposed underneath, surface melt accelerates. The large amount of fresh snow in June substantially dampened this feedback.
Read More: Climate Scientists build laboratory under the ice with a balloon
After the slow start to the ablation season, there were some substantial pulses of melt – particularly in July. Summer snow and rain over the ice sheet added more mass but did not significantly reduce melting in the lower parts of the ice sheet. Maximum melt occurred – much as usual – in late July, with daily SMB values well below the average due to the high melt and runoff rates in this period.
The large swings in the daily SMB reflect the weather in Greenland. Very unusually, July 2017 managed to set both a new cold record (-33C on 4 July) and a new warm record (+1.9C on 28 July) at Summit station on top of the ice sheet.
July and early August were also dry – especially in the south and west – with conditions proving perfect for the spread of two wildfires adjacent to the ice sheet. These are unlikely to have had much impact on the ice itself, but are perhaps a sign of changing climate and vegetation conditions on the land in Greenland.
From mid-August there was one final surprise in this unusual year. Although it was still warmer than average in much of Greenland, a series of storms swept over from the west and northwest, bringing more rain and snow to balance the melt losses (and extinguish the wildfires).
The ablation season therefore ended roughly a week earlier than has been usual over the last couple of decades. Melt continued, but the ice sheet started to gain more ice than it lost from 18 August this year.
Read More: Arctic sea ice is approaching the limit of natural variability
Calving
So far we’ve only discussed the surface processes. Incorporating the losses from calving gives us the “total mass budget” for the year.
Since at least 2002, the total mass budget has been substantially negative, with the Greenland ice sheet losing around 200-300bn tonnes of ice each year. This year, thanks partly to Nicole’s snow and partly to the relatively low amounts of melt in the summer, we estimate the total mass budget to be close to zero and possibly even positive.
We should emphasise that this is an educated estimate of the Greenland total mass budget. We will have to wait for further data to become available from various satellite datasets to estimate the actual calving losses. (Unfortunately, it’s not certain the ageing GRACE satellites, which show the trend in mass loss, will provide any more data. Their replacements are planned for launch later this year.)
Read More: Greenland Ice Sheet has already caused nearly five metres sea-level rise
So, overall, how has 2016-17 been for the Greenland ice sheet? Well, it hasn’t been a particularly bad year – the year-on-year decline of the ice sheet has been slightly checked. The 2016-17 season demonstrates how important year-to-year weather conditions in Greenland are in determining the annual SMB – showing that individual years can buck the long-term trend.
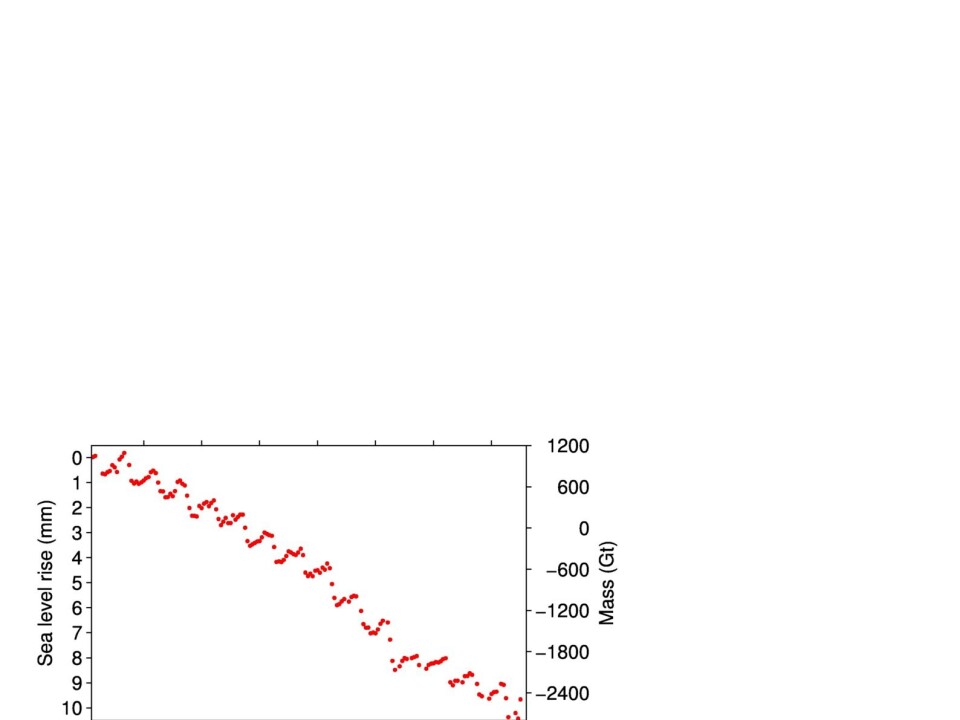
But while the Greenland ice sheet has seen a neutral, or small positive, change in ice for this year, it should be noted that Greenland has lost approximately 3,600bn tonnes of ice since 2002.
And, as you can see in the chart below, this has added about 1cm to global average sea levels.
---------------
This article was originally published on Carbon Brief.