New method identifies the most vulnerable glaciers in Greenland
Using an old theory and a new high tech dataset, scientists have developed a simple method to assess which of Greenland’s glaciers might contribute the most to sea level rise.
Scientists now have a relatively quick and simply method to assess which of Greenland’s glaciers are the most and least vulnerable to climate change.
In a new study published in Nature Geoscience, scientists have taken an old theory of how glaciers retreat and advance, and combined it with updated satellite imagery to identify how vulnerable individual glaciers are to ice loss in the near future.
“In a nutshell, we took an existing theory that’s been around since the 1950s and using new satellite and airborne observation datasets, we show how different outlet glaciers along the Greenland ice sheet will respond differently to forcing at their termini—the front of the glacier,” says lead-author Denis Felikson, a graduate research assistant at The University of Texas Institute for Geophysics (UTIG) and a Ph.D. student in The University of Texas Department of Aerospace Engineering and Engineering Mechanics.
The new results help glaciologists to understand a long-running conundrum of why some glaciers have lost more ice than others.
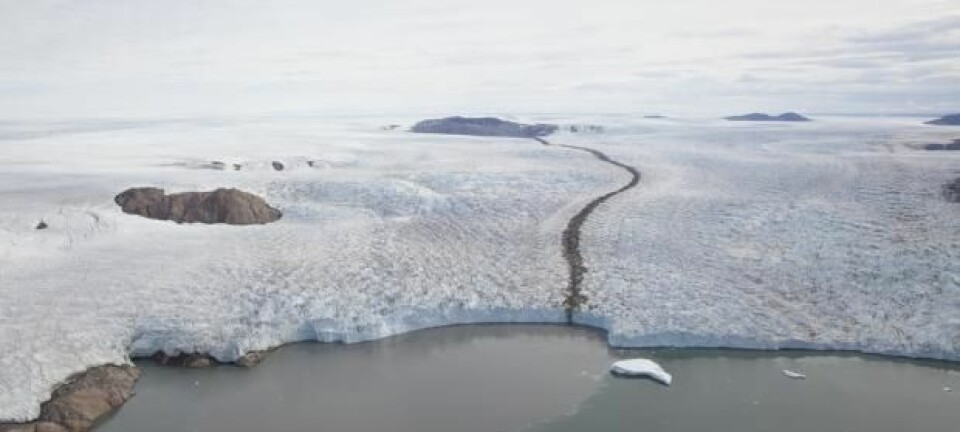
Jakobshavn Glacier
Also known as Jakobshavn Isbrae has already thinned 120 kilometres inland from its current terminus.
It accounts for more than 81 per cent of total ice lost in the study area.
But according to the new study, this thinning phenomenon could continue to extend up to 243 kilometres inland.
That is one third of the width of the entire Greenland ice sheet at the latitude of this glacier.
Ultimately, the new method could help scientists to identify which glaciers are “the ones to watch” and thereby improve their estimates of future sea level rise.
Explains why not all glaciers are losing ice
On the whole, Greenland is losing ice faster than it has been gaining it. Ice loss from Greenland’s glaciers has caused 25 millimetres of global sea level rise since 1840, and the biggest losses have occurred in the past decade.
But just like people, glaciers are individuals, and they all respond differently to climate change. Many have retreated rapidly and are already contributing to sea level rise in a big way, while others have changed very little and some have even grown. But until now scientists have not been able to say precisely why this is.
“Often even neighbouring glaciers - which must be under similar climatic conditions - respond in starkly different ways. If we can’t explain this apparently complex behaviour then it diminishes our ability to predict how glaciers and ice sheets will respond in the future,” says glaciologist Sam Doyle from Aberystwyth University, Wales.
The new study explains some of this complexity, says Doyle, who was not involved in the study.
Read More: Sea level rise: How far and how fast?
West Greenland’s most and least vulnerable glaciers
Felikson and his colleagues studied 16 glaciers along the coast of West Greenland. They identified three, with certain characteristics that could put them on the watch list for possible top contributors to sea level rise in the region.
One of these glaciers came as no surprise to the scientists: Jakobshavn Isbrae, which is already retreating rapidly. In fact, it has retreated more than any other glacier in Greenland.
The other two were more surprising: one of them is not yet retreating, and another has only retreated a short distance. But all three show the hallmarks for big ice loss, according to the new study.
Conversely, the least vulnerable glaciers are Kangerluarsuup Sermia and Lille Gletsjer, even though these glaciers have retreated somewhat in recent years.
Read more about each of these glaciers in the interactive maps below.
These three glaciers in West Greenland are the most vulnerable to climate change and are likely to make big contributions to sea level rise, according to a new study. Click on each of the glaciers to learn more. (Interactive map: Catherine Jex / ScienceNordic)
Ice loss depends on the shape of the landscape
So why is it that not all glaciers respond equally as the planet warms? And how does the new study identify which glaciers are likely to lose more ice than others?
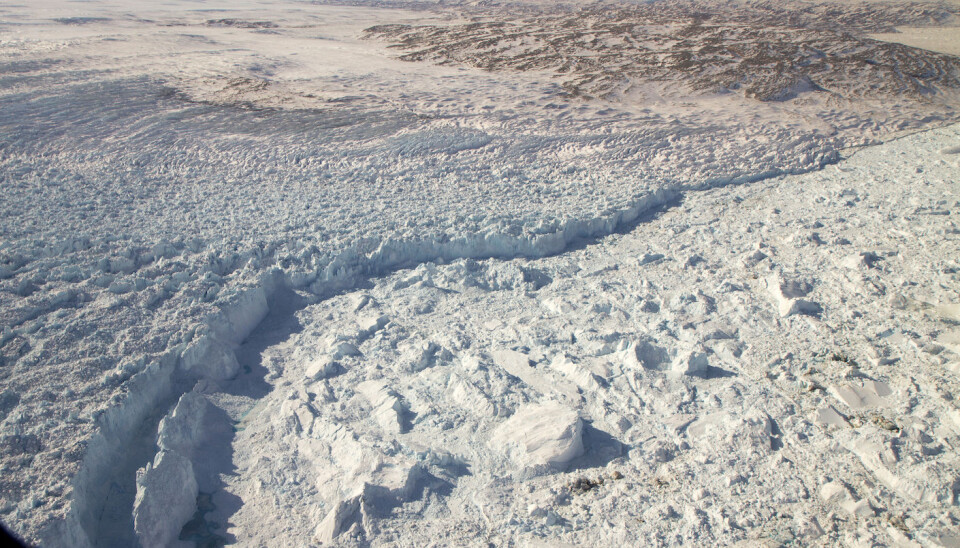
It all comes down to the changes happening at the front of the glacier--where the glacier flows into the sea--and how those changes affect the rest of the glacier, inland.
The glacier is susceptible to melt at its front, where the ice meets relatively warm seawater, and becomes thinner as a result. This thinning can extend surprisingly far in land, sometimes hundreds of kilometres.
The new study has discovered that it is the thickness of the glacier, the shape of the glacier surface, and the shape and steepness of the land under the glacier that controls how far this thinning phenomena spreads in land.
“For some glaciers, that distance extends very far into the ice sheet. Whereas for others, the geometry limits their thinning close to the front of the ice sheet. So when they’re forced to retreat, they lose ice at different rates,” says Felikson.
Read More: How the Greenland ice sheet fared in 2016
The “ones to watch”
The new study has calculated this thinning distance for the West Greenland glaciers, and has located the exact point at which this thinning stops.
They discovered that almost all of the ice lost when a glacier retreats comes from this part of the glacier--in front of this thinning point.
When this point is located far inland, it means that more of the glacier is exposed to this thinning phenomena. This means more ice loss from the ice sheet and more sea level rise.

The animation shows how a glacier thins until it reaches its natural “thinning limit.” The location of this “thinning limit” is controlled by the initial thickness of the glacier and the shape of the land underneath the ice. (Gif: ScienceNordic / Based on an illustration by Denis Felikson)
“Using this method you can determine an empirically derived number to say, at which point dynamic thinning of the glacier stops,” says co-author Niels Korsgaard from NordVulk, Institute of Earth Sciences at the University of Iceland. Korsgaard helped to produce much of the data used in the new study.
“Previously we could estimate where this point was from a general understanding, but now we can show it,” he says.
The method “is simple and empirically derived,” and only requires data on the thickness of the glacier and the shape of the underlying bedrock, says Korsgaard.
Crucially, this method can identify this thinning point before the glacier even starts to show signs of thinning and retreat and helps to identify which glaciers should be the focus of future research.
Read More: “Irreversible” glacier retreat in West Antarctica began 70 years ago
“An important step in the right direction”
So far, the scientists have assessed a small section of West Greenland. The task now is to expand their analyses to the entire ice sheet to understand how all of Greenland’s glaciers might respond to future climate warming, says Felikson.
In this respect, the new study is an important step that will help scientists to target key glaciers for future study, says Doyle.
“It’s a nice paper, combining observations with theory to explain the behaviour of the major Greenlandic glaciers that calve into the sea. It does a great job of explaining some of the complexity,” says Doyle.
“The natural world is complex, that’s why it’s so interesting to explore—and glaciers are no different. There are still other unknowns, but this is an important step in the right direction in our quest to fully understand glacier behaviour,” he says.
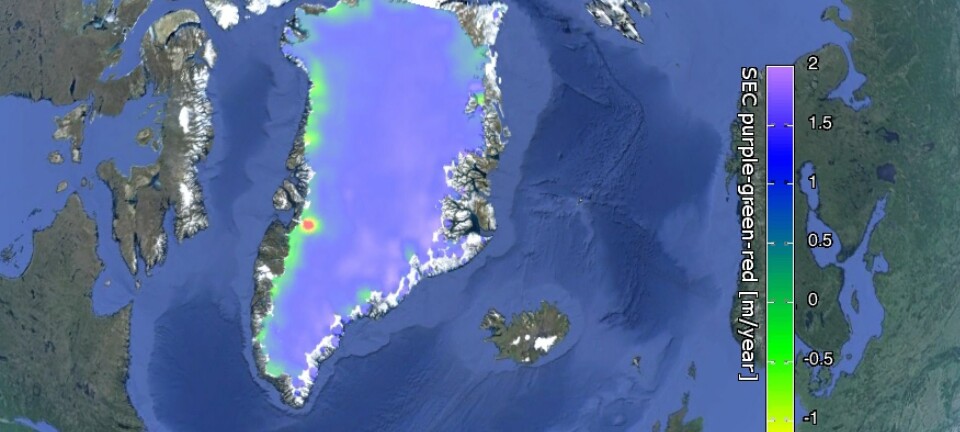
Explore the interactive map to see how glaciers in West Greenland are responding to climate change in different ways. Some have already lost vast amounts of ice and are retreating inland (deep red shading). Others have lost relatively little ice (light red shading), while some have actually gained ice (blue shading). The size of the circles indicates the amount of ice lost or gained since 1985. (Interactive map: Catherine Jex / ScienceNordic / Illustration: Felikson et al. 2017 / Nature Geoscience)