Climate models have not “over-predicted” warming
A new study suggests that the Paris climate goal may not yet be a physical impossibility. Even if true, this does not mean that climate models are wrong, as some media outlets reported.
A recent study in Nature Geoscience led to some interesting headlines. The study produced an updated estimate for how much carbon we could feasibly burn and still meet the most ambitious goal of the Paris Agreement to limit global warming to 1.5 degrees Centigrade above temperatures of the early 1800s.
Their findings were encouraging as it suggests that we may have a much larger, so-called carbon budget left than expected.
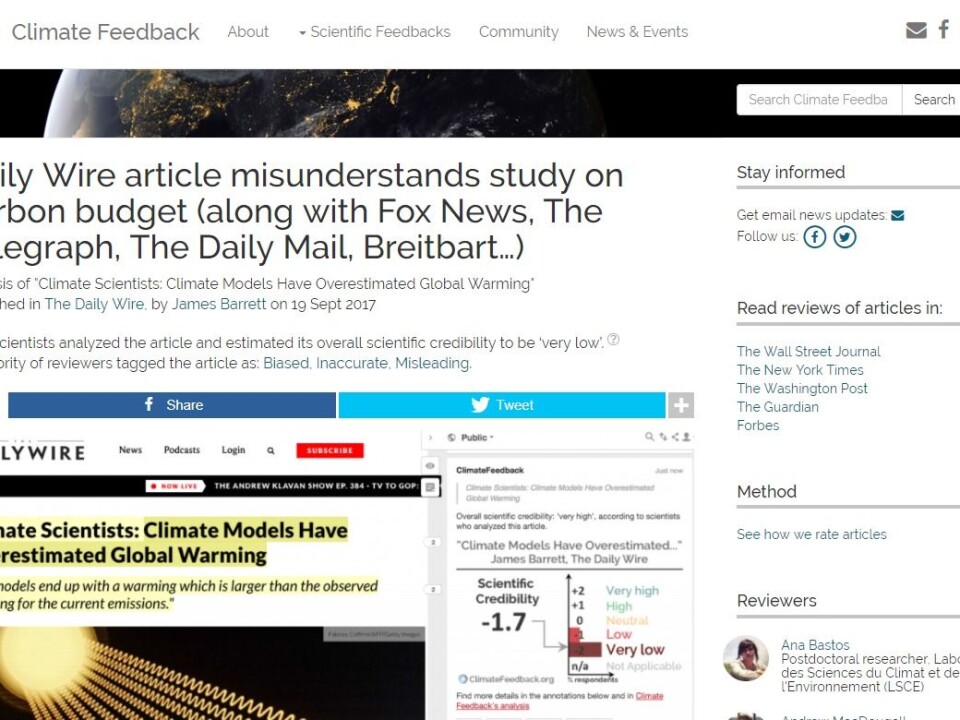
But some of the results were used by certain media to imply that climate models have over predicted warming in recent decades (see here, here, and here).
Such claims misrepresent the central results of the paper, as described in an article on Carbon Brief and in a statement released by the scientists themselves to correct some of these claims.

But where did the erroneous claims come from? And what do the actual results mean for our chance of achieving the Paris goals? Let’s jump straight in.
Read More: Scientists: Three years left to reverse greenhouse gas emission trends
Climate models are not “wrong”
The problem stems from a claim in the study that climate models overestimate the already observed warming by about 0.3 degrees Centigrade or roughly a third of the overall observed warming during the last 130 years.
Some media used this figure to conclude that climate models must be “wrong” and that, as a consequence, the IPCC has overestimated global warming, and that it is therefore less urgent to reduce the emissions of greenhouse gases than previously thought.

None of this is true. Or rather it is a misconception, as I will explain.
But first it is important to state upfront that the paper actually finds that observed warming is in line with projections made by the IPCC models. And while it is true that observed warming is at the lower end of the full range of projections, they are still within the range of model results. So no major controversy there.
Read More: What will our climate look like in 2050?
Reducing carbon emissions still an urgent issue
Crucially, the new results do not change the fact that if we want to reach the 1.5 degrees Centigrade Paris goal, we need to start reducing emissions immediately. However, in calculating a new carbon budget, the study suggests that we may have a slightly bigger budget remaining to us than previously thought.

According to their analysis, this new budget gives us 40 years to reduce emissions to zero and still stand a chance of achieving the most ambitious goal of limiting warming to 1.5 degrees Centigrade that was agreed to by governments around the world in the Paris Agreement.
This is good news, as if true, the chances of achieving this goal have gone from “virtually impossible” to “very ambitious, but theoretically achievable” - but only if we focus our efforts and find technical solutions that draw CO2 from the atmosphere.
Read More: Can we really limit global warming to “well below” two degrees centigrade?
Here comes the “but...”
So where did this controversy come from?
Apparently, the problem arose with one statement in the paper, which my DMI colleagues and I also stumbled upon:
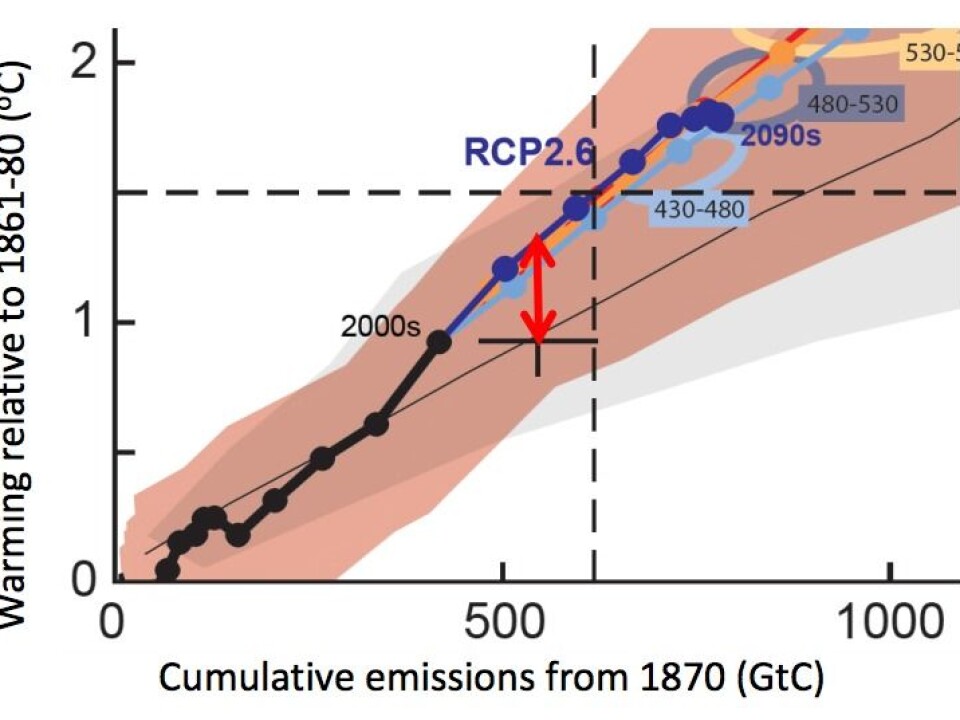
They state that after 2020, the average (mean) man-made warming predicted by a group of climate models known as CMIP is about 0.3 degrees Centigrade warmer than the estimate of man-made warming up to 2015.
But there are significant problems with this figure. Firstly, it suggests that this difference is due to climate models overestimating the already observed warming, which is a misinterpretation. Secondly, the difference also depends on both the type of model and the observational dataset used, and it is partly based on the fact that the model output used here is not directly comparable with the recorded temperature datasets. Taking all this into account makes the 0.3 degree difference more or less disappear.
This sounds a bit complicated so lets break each of these down in turn to figure out what the 0.3 degrees claim actually means and why it led to confused claims of models “over predicting” global warming.
Read More: Forests play important part in cooling down local climate
(1) It compares apples with oranges:
The authors compare temperature observations from 2015 to model estimates for 2020 as part of a larger analysis to estimate the remaining carbon budget and test the feasibility of the 1.5 degrees Paris goal. In doing so, they tried to estimate how much carbon might be left for us to burn and still remain just below the 1.5 degrees target.
But this method cannot and was never intended to be used to assess whether the models are “too warm”. To do that, you can “simply” compare the average model result for 2015 with observations for 2015. And this results in a difference of just 0.17 degrees Centigrade, which is still within the full range of all model projections, as mentioned earlier.
Comparing observations from 2015 with model estimates for 2020 is fraught with difficulties. Most notably, model projections for temperatures in 2020 are based on CO2 concentrations in 2020, which will be higher than was observed in 2015. This means that you cannot directly compare the two, as it is like comparing apples with oranges. If one wanted to do that, a more straightforward approach would be to compare one set of models for 2020 with another for that same year, but that is not the aim of this study.
That said, in order to compare 2015 observations and 2020 projections, natural variability (the component of climate variability not driven by human factors) has to be removed from the analysis. This includes, for example, El Niño—a pattern of temperature anomalies in the Pacific Ocean known to warm the atmosphere by a few tenths of a degree.
Since no actual observed data goes into these models they cannot predict the exact timing of these events, but statistically, El Niño events appear in models as often as they do in the real world. This is quite remarkable, considering that these models produce simulations of hundreds of years of climate at a time without any actual meteorological observation data, and yet they are able to depict the present climate (weather statistics) extremely well.
Read More: Nordic project will solve a riddle of dramatic climate change
(2) The study only evaluates one of many available climate datasets:
The authors look at only one dataset of observed temperatures, which has the catchy name, HadCRUT4.
There are several other datasets, including NOAA and NASA/GISS that go back to 1880, and others that could have been used, such as Cowtan and Way and Berkeley Earth, which go back to the 1850s.
DMI scientists have often pointed out one crucial difference between these datasets: While the other data sets use elaborated extrapolation techniques to fill data-void regions, for example in the Arctic, HADCRUT does not.
This is an important point when it comes to assessing temperature changes in these datasets. The Arctic has warmed more than the global average recently, with the consequence of receding glaciers, very low sea ice cover, and melting along the edges of the Greenland Ice Sheet, so leaving Arctic data out likely leads to an underestimation of warming in the final dataset. And indeed, the difference is biggest with the HADCRUT4 dataset than the others named here.
So the choice of observational dataset used also influences the difference in temperature between models and observations.
The authors focus on the remaining carbon budget to stay below the 1.5 degrees warming with respect to pre-industrial values. This means, of course, that warming from the mid-1800s had to be taken into account. However, observations that early cover only a small portion of the globe and there are therefore inherent uncertainties. Other approaches that to a smaller amount rely on early data have come to different results implying a smaller difference.
Read More: Seaweed plays a surprisingly large role in global climate
(3) Comparing models and observations is not as straightforward as you might think:
A further complexity worth noting is that climate models do not produce values that precisely match the location or height of the observed temperatures. This means that you have to make some adjustments to the data in order to compare one with another.
Models estimate atmospheric temperatures at two metres above the Earth’s surface at evenly spaced intervals across for the entire planet—land and ocean. Observations, however, are measured over the land (also two metres above the ground), and in ocean water, measured just below the surface. This creates a difference, because the ocean and air heat at different rates, and so if the planet warms over time the surface of the ocean will remain slightly cooler than the air immediately above it because it warms more slowly. In 2015 the surface of the ocean was 0.08 degree Centigrade cooler than the actual air above.
If you take this effect into account then HadCRUT only shows 0.09 degree less warming than the model average, while Berkeley shows slightly more warming than the average. This is not to say that the authors’ analysis is wrong, but it highlights the fact that it is a single paper’s conclusion based on a particular dataset and thus the results must be seen in this context.
Read More: One quarter of the Arctic is a hotbed for overlooked greenhouse gas
Climate models are performing well
Once all this is taken into account, it turns out that observations lie well inside the range of model anomalies. Even during the so-called “hiatus,” which describes the apparent lack of warming in the early part of the 21st century, observed temperatures are well inside the model range.
It is true that models have shown a little more warming than what has been observed. And so while it cannot be ruled out that the climate sensitivity of the models is slightly too high, this effect cannot be large. For example, since 1970, models project a decadal warming of 0.19 degrees, while observations are somewhere between 0.17 and 0.18 degrees.
What is clear however, is that under no circumstances should this new study be used or misused to make an assessment of the sensitivity of climate models based on the infamous 0.3 degree figure.
---------------
Read this article in Danish at ForskerZonen, part of Videnskab.dk


