Now anyone can be an Arctic Scientist
Scientists from around the world have launched a new website, which makes vital information on vulnerable permafrost available to all.
A new website, which enables anyone to try their hand at being an Arctic scientist or engineer, has just been launched
The Global Terrestrial Network for Permafrost is a freely available collection of ground-temperature data that spans the entire Arctic region, and is a product of a global collaboration of universities and research institutes.
“This is open to the public, so anyone can go and play with the raw data or look at the plots and maps that have already been generated,” says Thomas Ingeman-Nielsen, associate professor at the Arctic Technology Centre at the Technical University of Denmark.
Ingeman-Nielsen is one of the many scientists responsible for bringing the project to life and is responsible for encouraging scientists working in Greenland to upload their data.
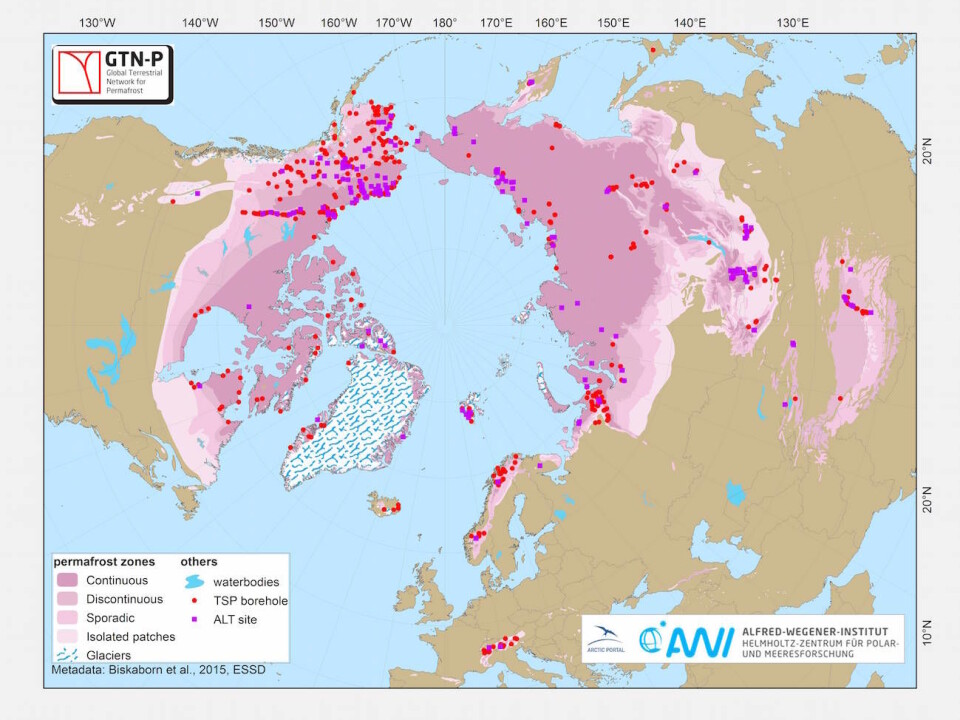
The project was recently described in a paper in the open-access journal Earth System Science Data.
Scientists share and share alike
The website includes data on ground temperatures in permafrost--land that is permanently frozen--and the thickness of the so-called active layer, which is the soil layer above permafrost that thaws in the summer.
So far, they have collected data going back almost 50 years from all across the Arctic. That data is already being used to study how permafrost is responding to climate change.
“The big advantage of collecting all this permafrost data is that it’s much simpler to get an overview of regional and global permafrost temperatures and to use this information to validate climate models and to model permafrost-climate system interactions, which has been lacking until now” says Ingeman-Nielsen.
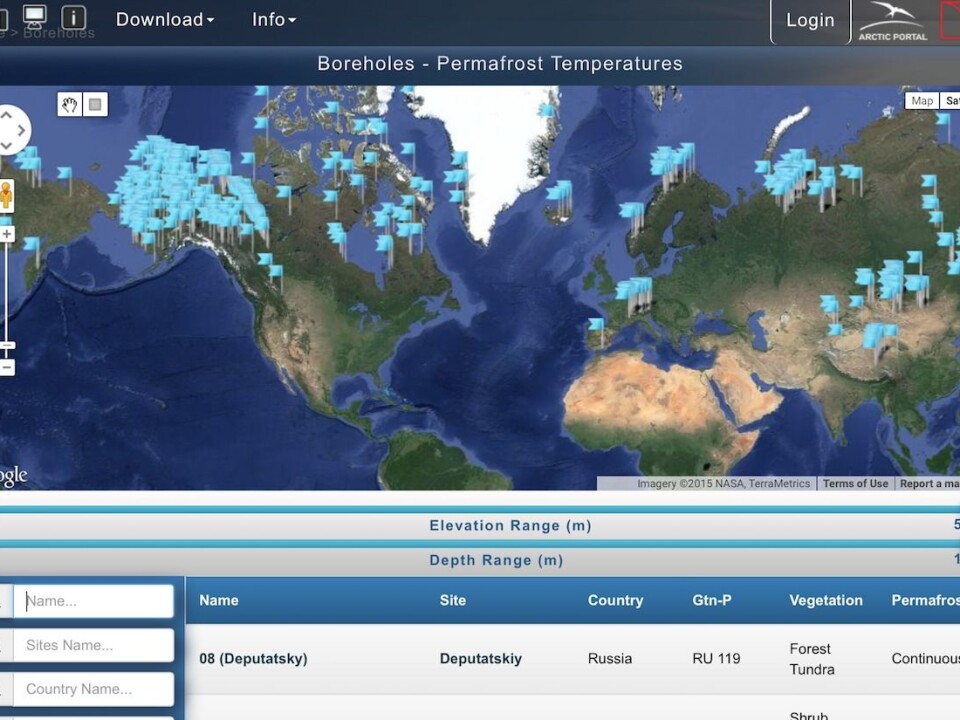
With the new temperature database, scientists are now able to check climate model predictions against observations from right across the Arctic region.
Practical planning in permafrost regions
Ingeman-Nielsen is using the data to study how permafrost reacts to the construction of buildings or large infrastructure projects, like airports, in Greenland.
“In these projects it’s important to choose the right foundation techniques, and to know whether the soil can continue to support the infrastructure or building when permafrost temperature changes,” says Ingeman-Nielsen.
You can read more about permafrost on the project website and play with the data by accessing the database.
