Share your science:
Seabed methane release follows the rhythm of the tides
SHARE YOUR SCIENCE: Methane is constantly being released from the seabed into the ocean. A recent study in the Arctic Ocean shows that this release follows pressure changes in the sea level related to daily lunar cycles.
Methane is among the most potent of the greenhouse gases and the largest methane reservoir on Earth is stored under the oceans. Maritime technology for mapping the oceans floor shows us that methane is being constantly released into the oceans – a natural phenomenon known as methane seepage.
This is a widespread phenomenon that has been occurring for hundreds and even millions of years. The phenomenon has a strong connection not only to our global climate, but also to deep seabed ecosystems and underwater landslides and tsunamis.
Tide cycles intensifies methane emissions
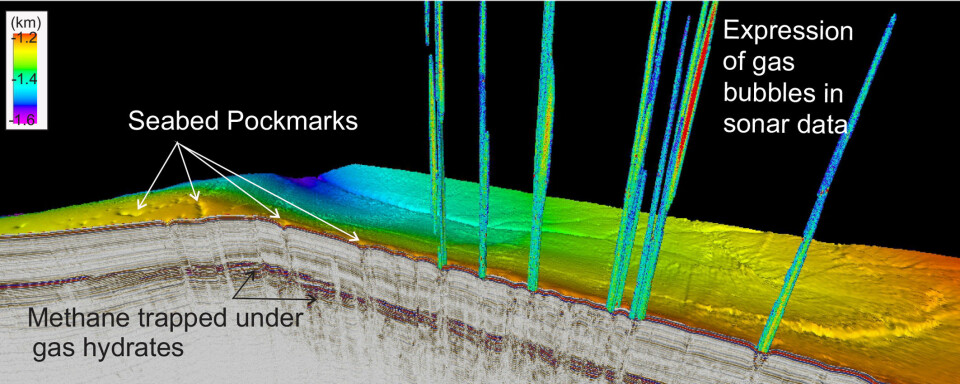
The Arctic Ocean leaks enormous amounts of methane. Various studies indicate that leakage intensifies when glacial ice disappears. However, leakage also intensifies on a daily basis as methane bubbles, recorded in sonar data, experience a cyclic increase and decrease of their intensity in accordance to daily tide cycles.
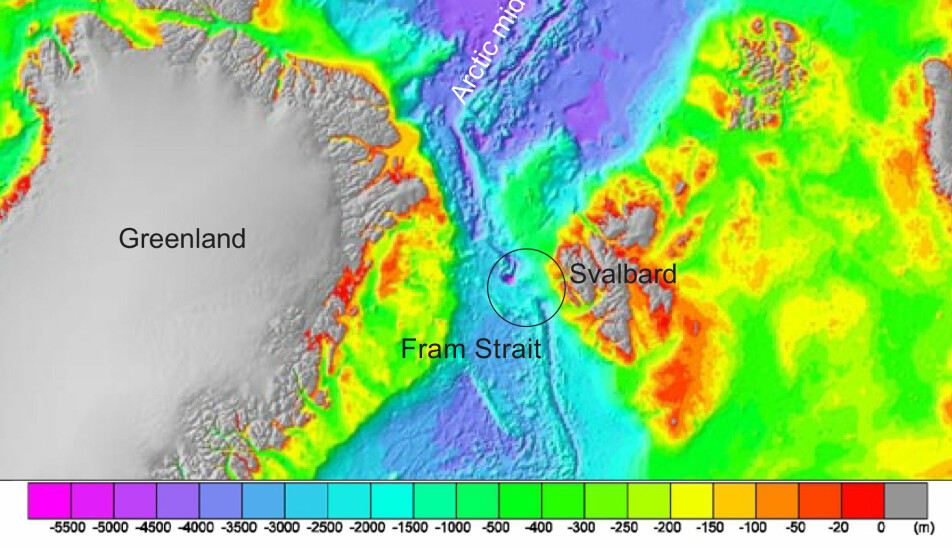
We have studied this phenomenon in an experiment conducted at more than 800 meters water depth off the west coast of Svalbard using a piezometer, an instrument that allows measuring pressure changes inside the sediment. Here we describe the experiment and the fascinating findings.

Cracking and stretching
The continents are constantly moving. While some continents are separating from each other, other continents are crashing against each other. Every year Norway moves about two centimeters further away from Greenland forming the Arctic region we know as the Fram Strait. The Fram Strait is the largest and only gateway allowing the exchange of deep waters between the Arctic and the Atlantic Ocean.
The Arctic Ocean was opened thanks to the (still ongoing) separation between Greenland and Norway. This separation resulted in the formation of the Arctic mid-ocean ridges. Melted rock that comes out through these mid-ocean ridges form underwater mountains that are constantly expanding to the sides of the ridge.
The Earth region between these mountains and the dry land are called continental margins. These continental margins become cracked due to high pressures or stretching forces generated by the constantly growing underwater mountains. Continental margins, either covered by glacial ice such as Greenland today or Svalbard some ten thousand years ago, are even more prone to cracking at present day. These continents are constantly bending back to their original shapes, now that the weight of the ice has disappeared (as is the case in Svalbard) or is currently disappearing (as in Greenland). All this cracking facilitates the natural release of methane into the ocean.
A natural laboratory
The Fram Strait region is a natural laboratory for understanding the Earth’s ocean currents, global climate, plate tectonics, as well as studying the methane seepage phenomenon. Leakage of methane in the Fram Strait has been discovered using the sonars from the ship. The sonars are instruments that produce and record echo that travels from the ship, to the seafloor and back. When an echo passes through something other than seawater (for example fish, gas bubbles and mammals) the energy of the echo appears as a colorful contrast in the screens of the ship. The gas bubbles appear as vertical colorful shadows called “gas flares”.
There are numerous vessels of all kinds navigating the eastern Fram Strait every year and reporting such “gas flares” in the water that are systematically located at the same spots along the Svalbard continental margin - at approximately 80 meters, between 300–400 meters and at approximately 1200 meters water depth.
Moreover, geological, biological and geophysical data show evidence of past methane leakage at the seafloor where flares are not observed today. This tells us that methane leaks were much more abundant and intense in the past. Intrigued by what is controlling where, when, and how much methane leaks, we started a project (SEAMSTRESS – Tectonic stress effects on Arctic methane seepage https://site.uit.no/seamstress/) that through numerous experiments aims at solving this mystery.
How we measure methane in sediments
In one of the most revealing experiments so far, we measured the pressure and the temperature variations under the seabed using a piezometer. A piezometer is a tubular instrument that can be pushed into the ground to measure the pressure and temperature of water inside the soil.
When used at sea, the tube is open so the sensors inside it are in contact with both the pressure of the water column and the pressure at given depths inside the sediment. If the pressure inside the sediment is the same as the water pressure the instrument tells us that the water in the sea is nicely interconnected with the fluid inside the sediment. If the pressure inside the sediment is lower than the water pressure the instrument tells us that a material with less density that water (i.e., methane gas in this context) is present in the sediment.
Escaping gas, following the rhythm of the moon
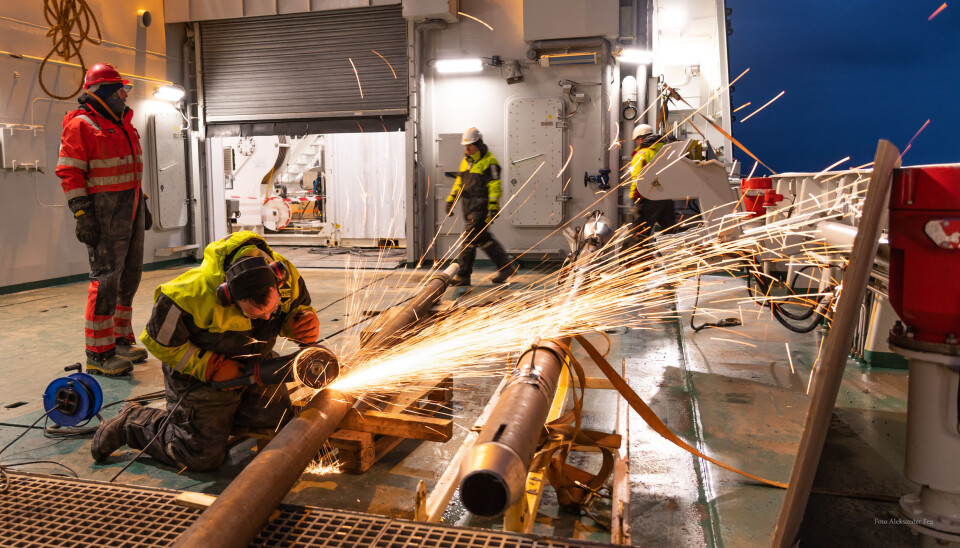
In 2019 we measured for the first time the pressure inside the sediment in a deep Arctic region. We carefully chose four locations off the west-Svalbard coast, where we could safely insert the piezometer. We were looking for sediment pressure differences between areas with and without obvious and pronounced methane flares. The Arctic weather made no exception with us and it became rough enough to impede sampling as planned. But the data collected from two of the sites were unexpectedly contrasting and revealed a fascinating link between changes in sea level and the pressure inside the sediments.
We left the piezometers recording the pressure over three days at two distinct locations. We could observe that at both locations the water inside the sediment was changing rhythmically following the tide cycles. One of our piezometers unexpectedly hit what we think can be a mud diapir (like a small mud volcano). Mud volcanoes and diapirs are formed as pressure increases beneath the seafloor pushing water, gas and mud towards the seafloor and eventually erupt. The piezometer data showed that at this location there was not only water in the sediment, but also gas moving upward, and escaping to the ocean following the rhythm of the moon.
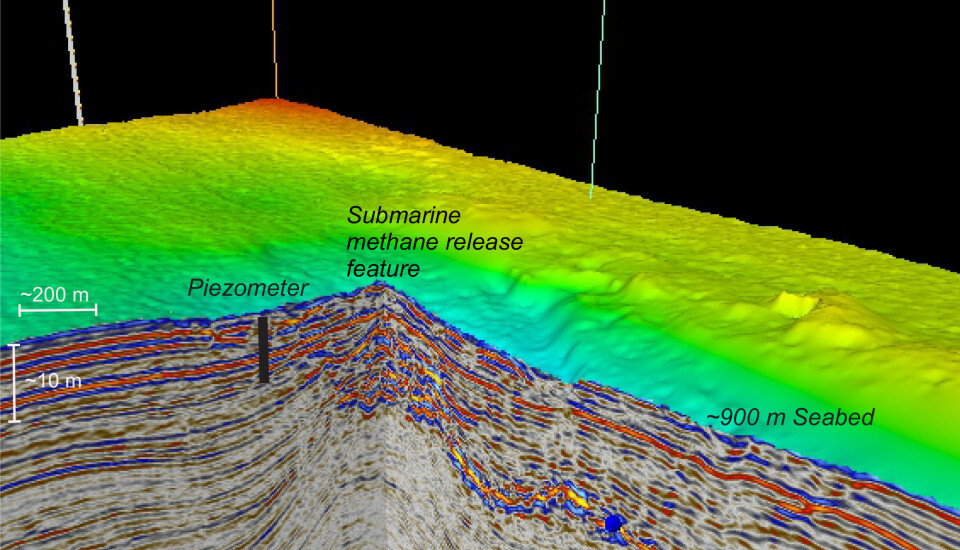
Connection between tides and sea-bed methane leaks
Methane is much more vulnerable to changes in pressure than water and the small decrease in the pressure exerted by the water column during low tides was enough to allow the gas to move upward and leak out to the ocean. The data recorded by the piezometer showed that the pressure went down towards negative values simultaneous to the tide fall. Similarly, the pressure went up following the tide rise. One cycle of pressure decrease and increase would last approximately twelve hours having a remarkable resemblance with the daily tide cycle. We could observe these over a period of three days. In addition, some of the low pressure/low tide periods corresponded with warmer temperatures in the sediment, indicating that warmer water from deeper in the sediment was moving upwards.
This relation between temperature, pressure and tide height revealed that tides were pumping gas and water from several meters under the seafloor into the ocean. Interestingly, the gas release into the ocean at this site has not been observed in sonar data, using the classical geophysical method described above. We suspect that the pumping of the gas by tides is not a regular process but that it occurs only for tide cycles when sufficient pressure has accumulated again in the sediment to force some gas out into the ocean-water.
A constant flatulence
This first piezometer experiment in the Fram Strait showed that seabed methane emissions can be much more spread and abundant – just like a constant flatulence – than anticipated by mapping the leaks with geophysical data. The experiment also showed us that the moon and the oceans contribute to the Earth rhythmic release of gas. In the future we should be looking into the installation of long-term piezometer observatories to better understand and quantify this fascinating connection between the moon, the oceans and seabed methane emissions.
Share your science or have an opinion in the Researchers' zone
The ScienceNorway Researchers' zone consists of opinions, blogs and popular science pieces written by researchers and scientists from or based in Norway.
Want to contribute? Send us an email!


