New world map of animal life
The new zoogeographical map of the planet is based on more than 20,000 species.
Biogeography involves the mapping and scientific explanation of the spread of life on Earth. The new world map of the planet’s land animals is based on data covering mammals, birds and amphibians.
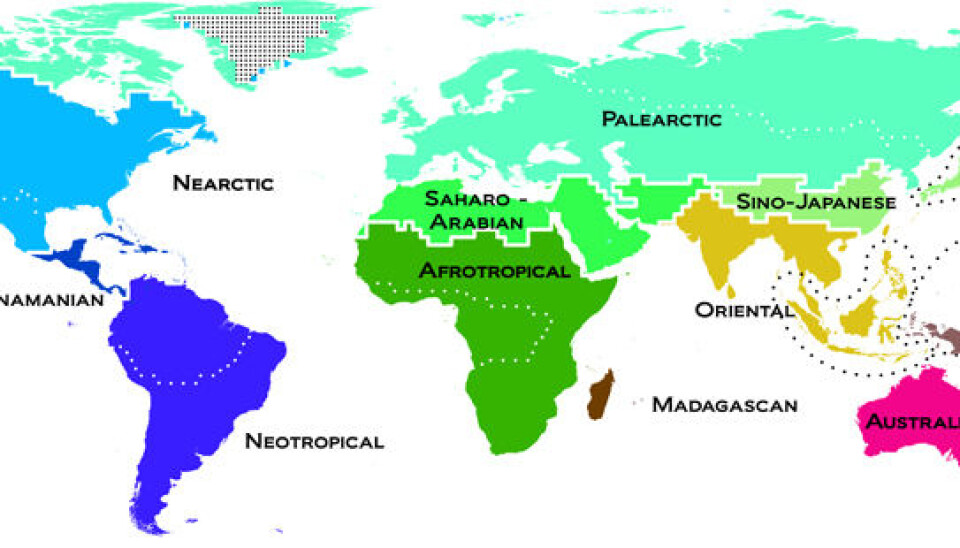
It divides the world into 11 major regions based on animal affinity.
In addition to the 11 zoogeographic realms, shown above, the scientists also mapped 20 smaller regions within their boundaries.
Large and small
Europe and the northern part of Asia are in the Palearctic region. In the new map this also includes Arctic Canada and Greenland.
It means that animals with habitats within this huge region share certain common traits.
The Palearctic region is immense. At the other end of the scale is the Madagascan region, consisting of the island of Madagascar, which has a special fauna.
Can be downloaded
The study and new map was made by Danish researchers, with good help from an international group of colleagues and 20 years of data collection.
The world map and the background material is accessible here. You can also download the map using Google Earth.
The project has been presented in an article in Science.
Pioneer of biology
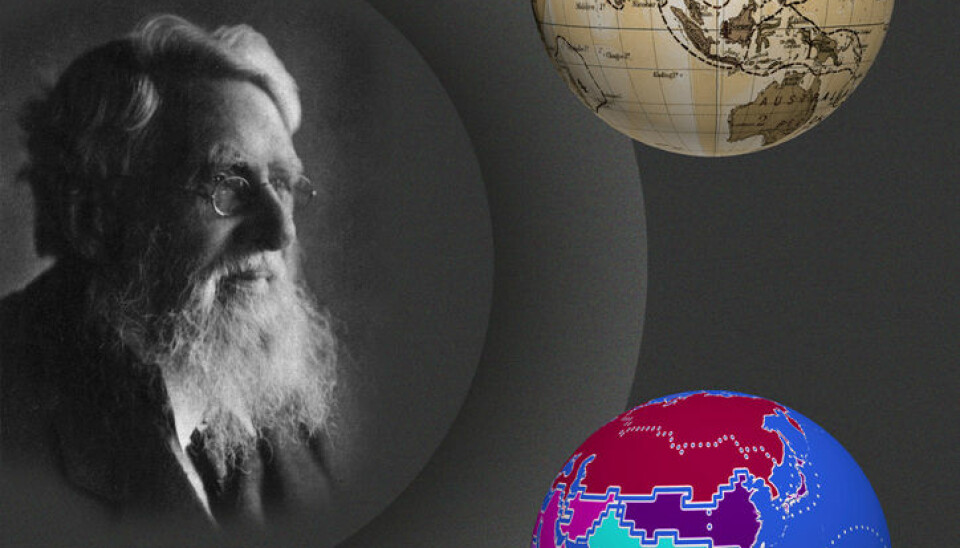
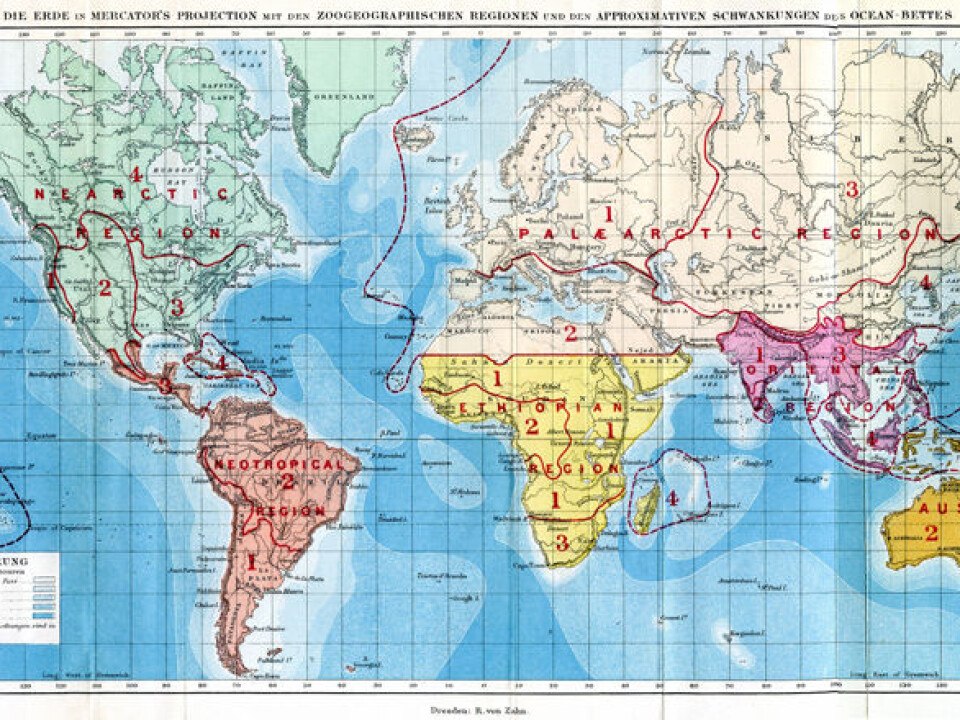
The map is an update of the zoogeographical map drawn by the pioneer in biology Alfred Russel Wallace.
He was a contemporary of the more academic and renowned Charles Darwin and is known for simultaneously arriving at the same conclusions regarding evolution.
Wallace published the first world map of animal life in 1876, point out the modern researchers in Science.
The original map divided the world into six major regions. The revision has nearly twice as many and the boundaries do not all coincide.
Evolutionary relatives
The new map is based on everything now known about phylogenetics, the evolutionary relationships among the species.
Using this knowledge the researchers were able to make a map that encompasses the unique traits of fauna in each region.
It shows that Australia differs the most from other regions, followed by Madagascar and South America.
Variations are greater in the Southern Hemisphere than in the North. This could be because there have been fewer barriers to cross in the Northern Hemisphere.
It might be because more species have survived in the South. Millions of years with greater climate instability in the North can have wiped out more species there than in the Southern Hemisphere.
Tools
The project was led by researchers at the University of Copenhagen’s Center for Macroecology, Evolution and Climate.
The map could be a useful tool for research and work to ensure biodiversity.
Researcher Ben Holt is one of the key authors of the study. He says this is a long-awaited update of one of the most used maps in natural science.
“Now for the first time since Wallace’s attempt we can create a comprehensive description of nature’s world based on an incredibly detailed study of thousands of vertebrates,” he says in a press release.
Marine mammals such as whales and seals were not included.
Nor are reptiles or invertebrates taken into account, which means the map could be altered when these are included. The map could also be re-drawn with a basis in flora instead of fauna.
------------------------------
Read the Norwegian version of this article at forskning.no
Translated by: Glenn Ostling
