NASA project reveals vulnerability of Greenland glaciers
A project to map Greenland’s coastal glaciers and fjords is under way and the initial results are in. New maps depict Greenland’s coast at an unprecedented level of detail.
An ambitious project is under way to study almost the entirety of Greenland’s 27,000 mile-long coastline with the aim of answering one question: how quickly are the oceans melting Greenland?
By the end of the five-year project, NASA scientists and their collaborators in Denmark and around the world will have mapped almost all of Greenland’s coastal glaciers, the surrounding sea floor, and ocean water temperatures, at an unprecedented level of detail.
They are trying to understand exactly how much ice loss in Greenland is driven by warmer oceans melting glaciers from underneath as they flow into the sea. Ultimately this will allow them to improve future projections of how much and how fast sea level will rise around the world.
“We actually refer to the project as OMG, which stands for Oceans Melting Greenland, but we also call it the ‘Oh My God’ project, because it’s just so large,” says project-partner René Forsberg from DTU Space.
“We have known for a long time that the oceans are causing Greenland glaciers to melt faster, but we really lacked the hard data to show this across the whole of Greenland and not just for an individual glacier. This is where OMG comes in,” says Forsberg.
The project is just two years in, but initial data are already publicly available via the OMG project website. Some of these results are now published in two studies (available here and here) in the scientific journal Oceanography.
Read More: Climate models underestimate rapid ice melt events on Greenland
OMG! Greenland is melting so fast!
There are of course lots of projects studying how much ice is lost from the Greenland ice sheet each year, and how the ocean currents and temperatures are changing in the deep oceans surrounding Greenland.
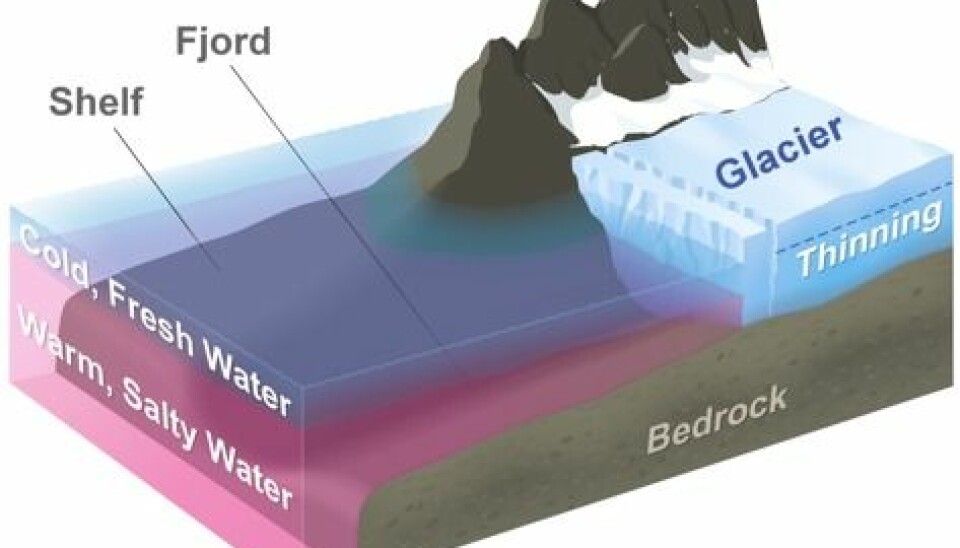
But scientists know surprisingly little about how the relatively warm waters that flow up from the Atlantic, interact with the cooler, Polar waters, in and around the hundreds of fjords that litter Greenland’s coast.
This interaction is crucial to understand how much and how far, warm Atlantic water can infiltrate into Greenland’s fjords and melt the glaciers from underneath.
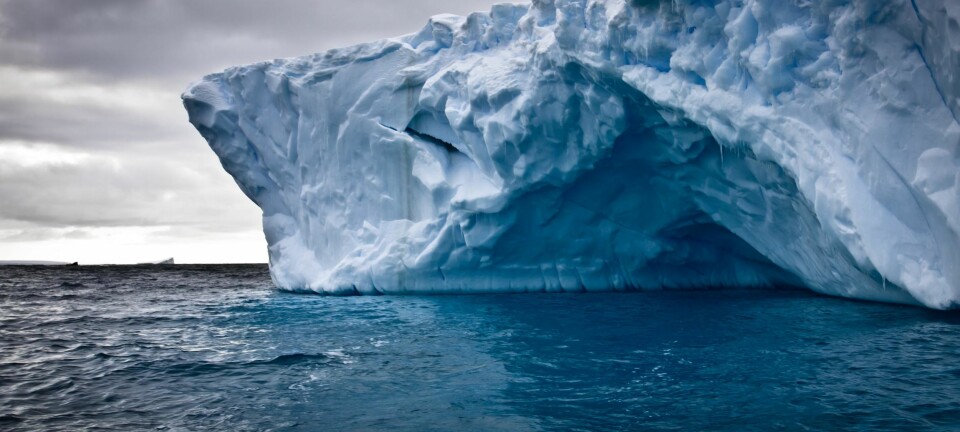
When this happens, more icebergs break away from the front of the glacier and essentially loosen the tap, allowing the flow of ice from land to sea to speed up.
Unsurprisingly, warmer oceans means more melt, and this is what many oceanographers and glaciologists believe has been driving some of the increasing loss of ice from Greenland over the past 30 years.
Read More: Nordic project will solve a riddle of dramatic climate change
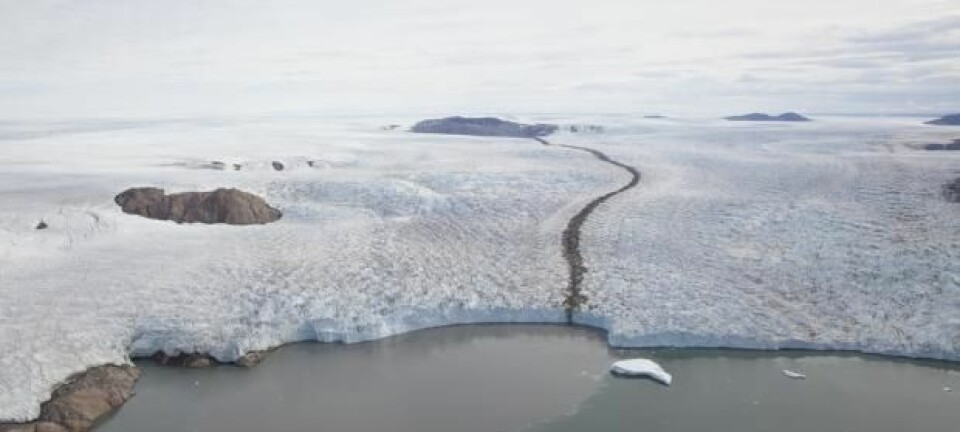
New maps reveal deeper fjords and vulnerable glaciers
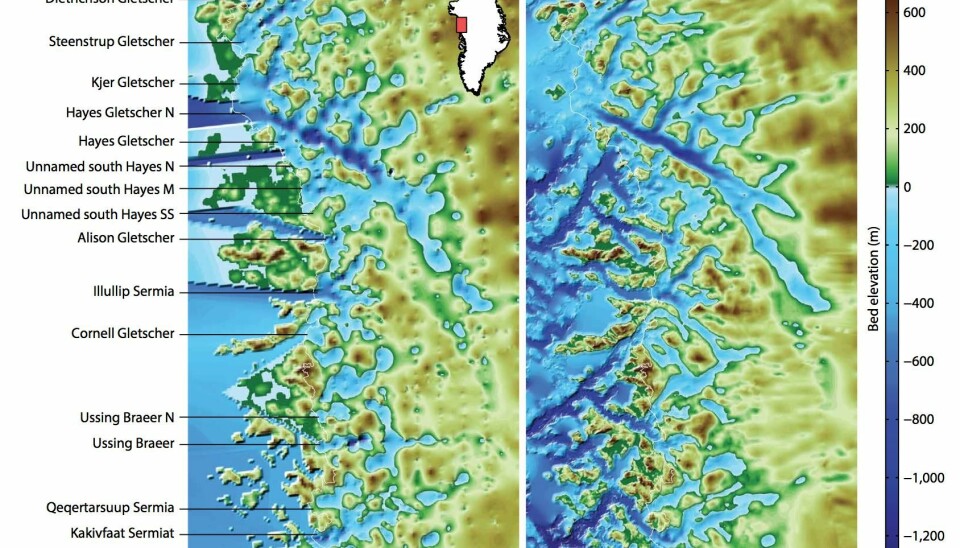
So far, the project has produced detailed maps of the sea floor, revealing many deep trenches—the perfect conduits for heavy, deep, warm Atlantic waters to flow underneath the cold and lighter Polar waters.
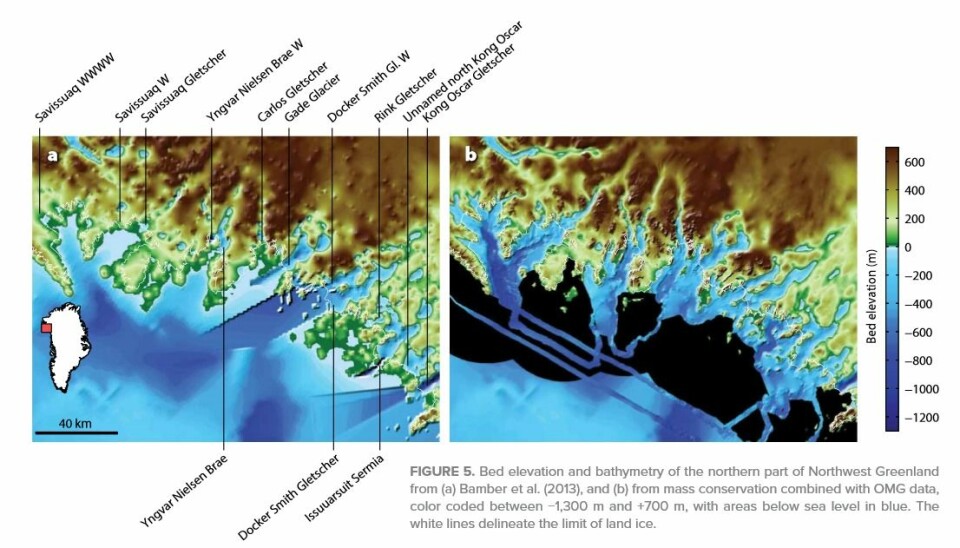
“The sea floor is actually not well covered by bathymetric mapping. So our understanding of some of these channels where the warmer water can reach the glacier have changed quite a bit due to the new data,” says Forsberg, a co-author of the first study that presents an overview of the new data, including sea floor surveys, ocean temperature data, and surveys of the coastal glaciers.
“Many are much deeper than we expected. So there are many fjords where the original bathymetry was actually quite wrong,” he says.

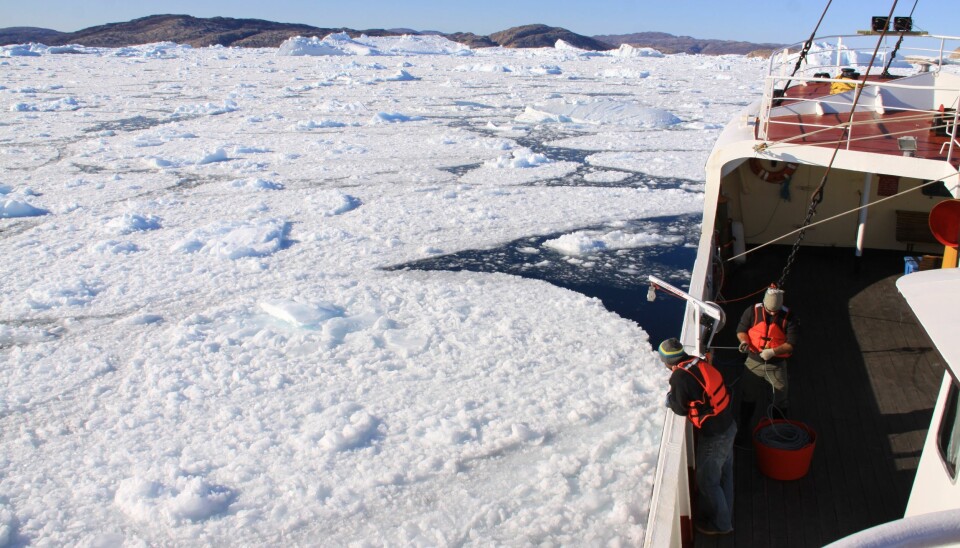
Each year the OMG scientists map the thickness and retreat of Greenland’s coastal glaciers from the air using an interferometer. They have also deployed probes from the air, to measure ocean temperature, depth, and salinity to see how warm Atlantic waters intereact with colder melt water in the fjords. (GIF: NASA JPL / OMG)
Many of these glaciers are much thicker than previously thought, and their ice extends much deeper into the fjord where it is vulnerable to melt by deeper, warm Atlantic waters.
“OMG will essentially give us a much better understanding of the processes of how much water is coming in and how much water can come in to the fjords,” says Forsberg.
The more detailed maps have also highlighted many features that impact on the movement of water in the fjords.
“Many of the fjords have what we call a sill—so they are shallow at the mouth and deeper at the back of the fjord, towards the ice. Knowledge of these sills and how the water flows around them, shows you how much water will come in and how much the glaciers could melt,” says Forsberg.
You can see some examples of the new maps in the gallery at the top of this article.

OMG scientists map the depth and shape of the sea floor by ship and air to see how much warm, salty Atlantic water enters the fjords and melts coastal glaciers from underneath. (GIF: NASA JPL / OMG)
Greenland’s west coast is most vulnerable
The results so far indicate that Greenland’s west coast is more vulnerable to ocean melt than the east coast, according to OMG team member Mathieu Morlighem from the University of California, Irvine, speaking to the Washington Post.
“OMG is transforming our knowledge of which glaciers are vulnerable to more warming,” says Morlighem, who is the lead-author of the second study that presents some of the new sea floor data in detail. They have identified new features such as valleys, ridges, bumps, and hollows in the fjords, which can help to channel ice flow into the fjord and control how much warm water can reach the glacier front.
He is not surprised by this vulnerability, but this is the first time that the scientists have been able to see the precise shape and depth of many of these fjords and glaciers to fully evaluate their vulnerability.
Morlighem hopes that as even more data are collected he and his colleagues will finally have the data needed to run computer simulations of water flow in and around the fjords. This will improve future projections of ice loss from Greenland and ultimately improve projections of future sea level rise.
Scientific links
- Oceans Melting Greenland: Early Results from NASA’s Ocean-Ice Mission in Greenland
- Improving Bed Topography Mapping of Greenland Glaciers Using NASA’s Oceans Melting Greenland (OMG) Data. DOI 10.5670/oceanog.2016.99
- OMG Project website