How volcanos collapse
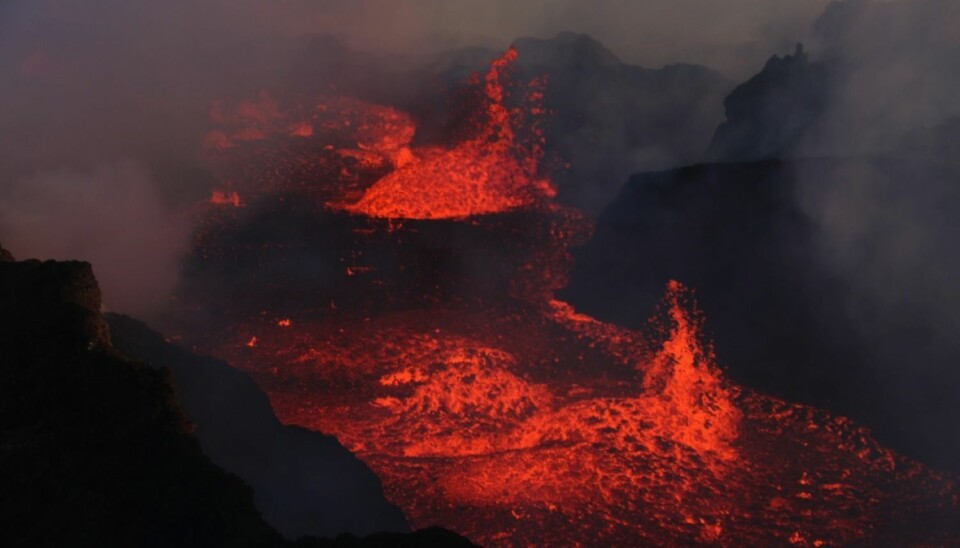
A unique set of data collected during the largest European volcanic eruption in over 200 years captured the inner workings of a rare event--the collapse of a volcanic crater.
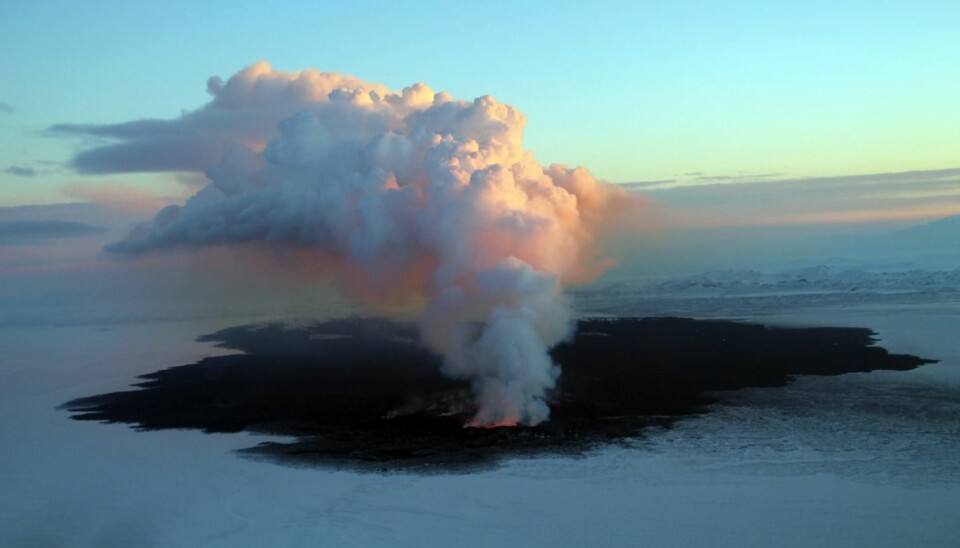
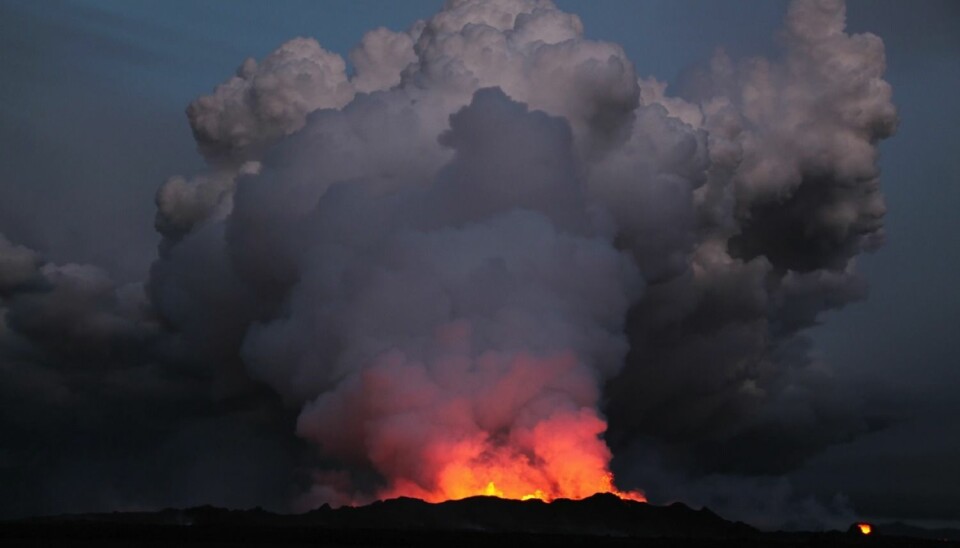
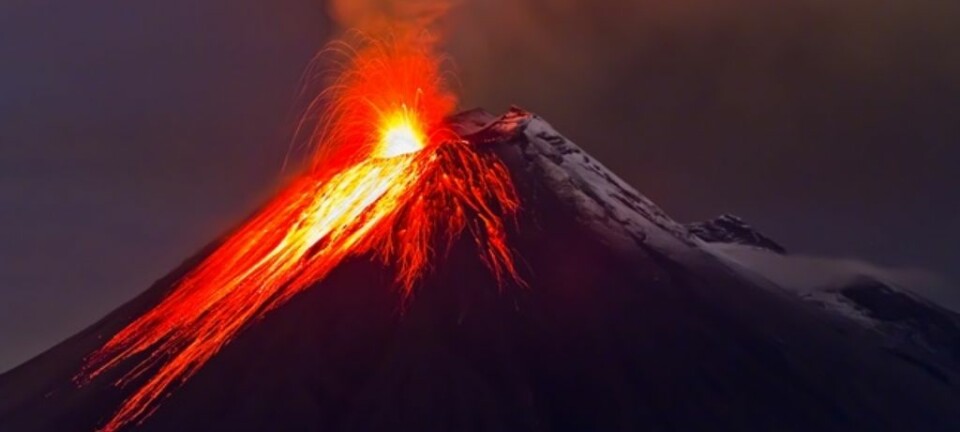
It might not be the most famous volcano in Iceland to make headlines in recent years, but when Bárðarbunga erupted in 2014 it marked the start of what would become Europe’s biggest volcanic eruption since 1784 CE.
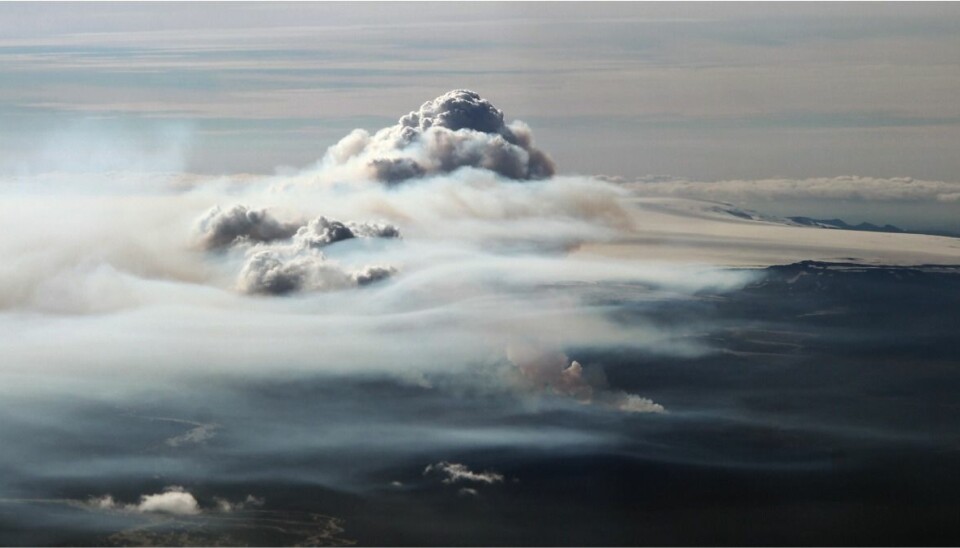
It didn’t spew ash into the atmosphere like the more famous Eyjafjallajökull eruption in 2010 and no aeroplanes were grounded, but as the eruption progressed a rare event occurred--the Bárðarbunga caldera (volcanic crater) collapsed.
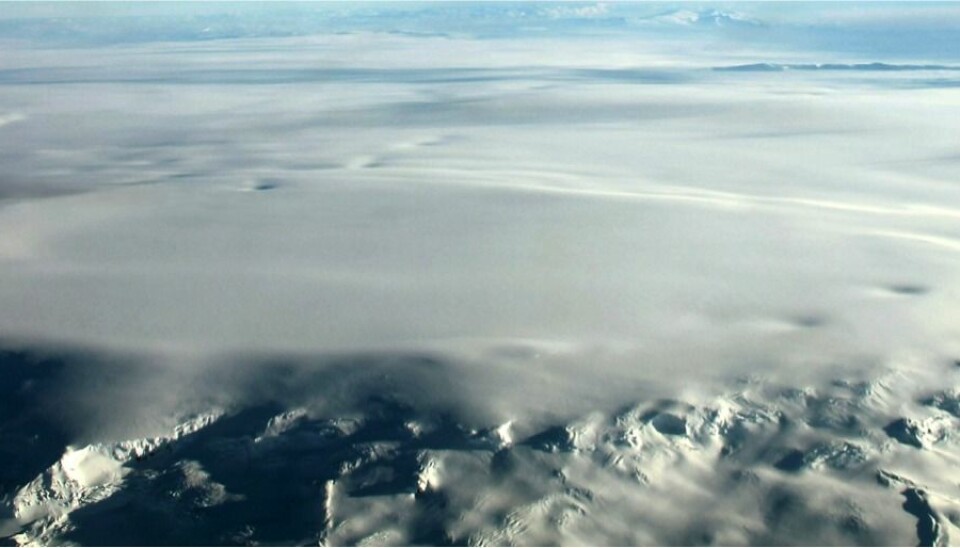
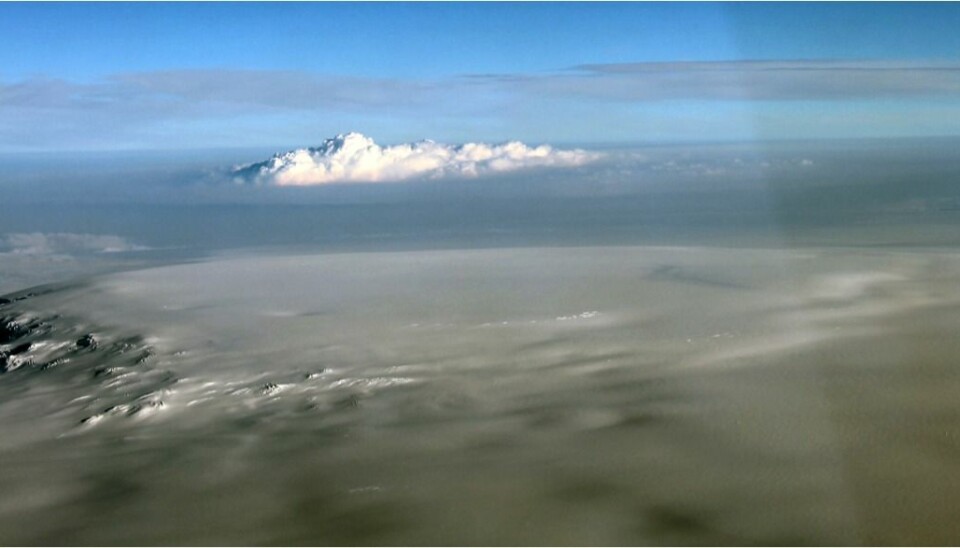
Around 110 square kilometres of the existing crater sank, leaving behind a 65 metre-deep crater.
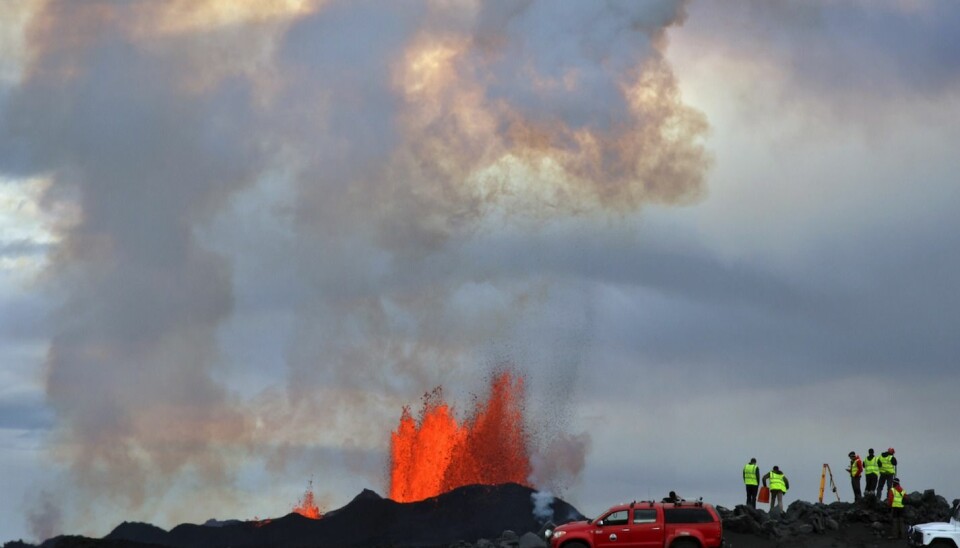
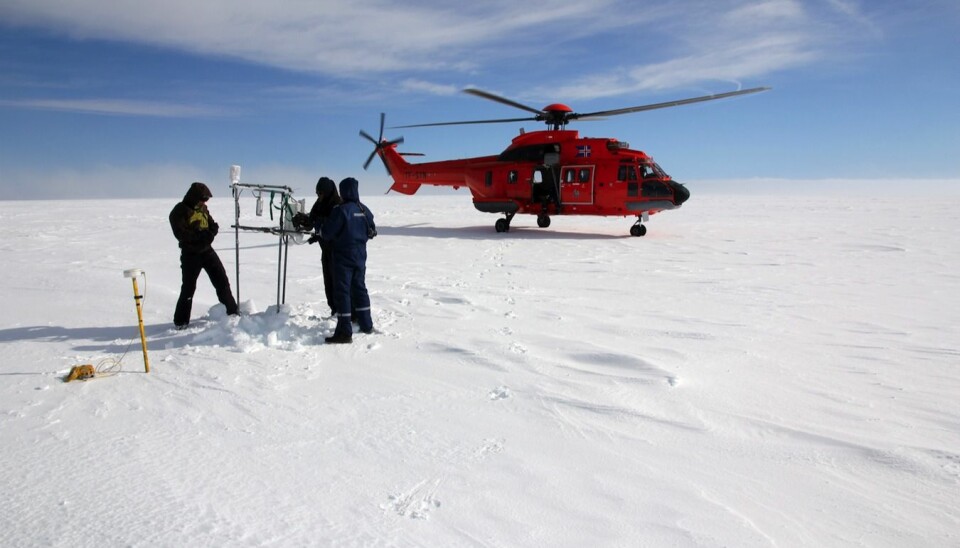
As events unfolded during the six-month long eruption, scientists were on site day in, day out, to monitor and measure everything that this momentous volcanic eruption had to offer.
“It’s the best dataset ever collected during a caldera collapse. Caldera collapses are really rare in nature because you need a big eruption to create such an event,” says co-author Kristín Jónsdóttir, from the Icelandic Met Office (IMO).
“We’ve learnt a lot by monitoring this event, not only about the caldera collapse, but also about how the volcanoes in this area work,” she says, and adds, “We now have a much clearer picture of big eruptions in Iceland.”
The data is published in the journal Science.
Simple model describes events as they unfolded
Scientists in Iceland had been monitoring the area since the 1990s. But they stepped up their efforts in 2013 as part of a large international research project to study so-called super-sites of volcanic activity--FutureVolc.
Jónsdóttir and her colleagues had just finished deploying more instruments to the area as part of the FutureVolc project when the eruption finally kicked off.
“This is one of the most volcanically active places in Iceland. Grímsvötn, the other volcano just south of Bárðarbunga is even more active. So it wasn’t just a blind guess to go there. But it was really good timing that the instruments were in place.”
The scientists were ready to record and monitor the whole thing from start to finish. They monitored earthquake activity (seismicity) in the caldera itself and the surrounding area. They measured faults as they were activated in the caldera, chemistry of lava and gas as it emerged, and deformation of the Earth’s surface from satellite imagery and observations, and subsidence within the caldera and movement of magma by GPS.
They combined all of these data with computer modelling to produce a conceptual model of the Bárðarbunga eruption and caldera collapse.
“It was a big team effort. And the strength of the paper is that we’re applying all these different methods and collecting different data to come up with a single model, and the most simple that explains all the data. We’re not leaving anything out. Many different techniques were used to get as much information from our data as possible,” says Jónsdóttir.
The Bárdarbunga caldera before and after the collapse.
Unique dataset reveals every stage of the eruption
In early August 2014, Icelandic scientists had noticed some signs of activity from Bárðarbunga, and so they met with local authorities to discuss it.
“We’re monitoring 33 active volcanoes in Iceland, and we talked about this in beginning of august with the civil protection authorities, that we were concerned about the increased seismicity and signs of inflation (expansion of the volcano surface) at Bárðarbunga. And then, very suddenly on 16th August, all hell broke loose,” says Jónsdóttir.
Events moved fast. Before the eruption, scientists were reporting just a few earthquakes a day, but suddenly their seismometers were recording thousands. But then the centre of this seismic activity began to move away from the caldera indicating that the magma was not about to erupt up through Bárðarbunga itself, but it was travelling sideways, away from the caldera.
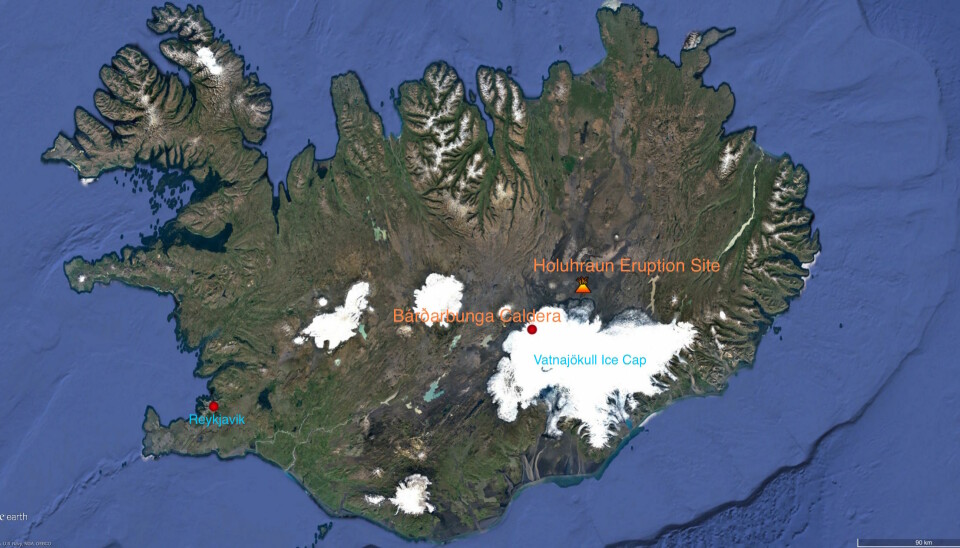
“By locating the earthquakes we could see how the seismicity was moving away from the caldera. Initially it was moving in three directions to the east, then slowly it concentrated on a path away from the caldera, and for 48 kilometres we could see it slowly propagate northeast,” says Jónsdóttir.
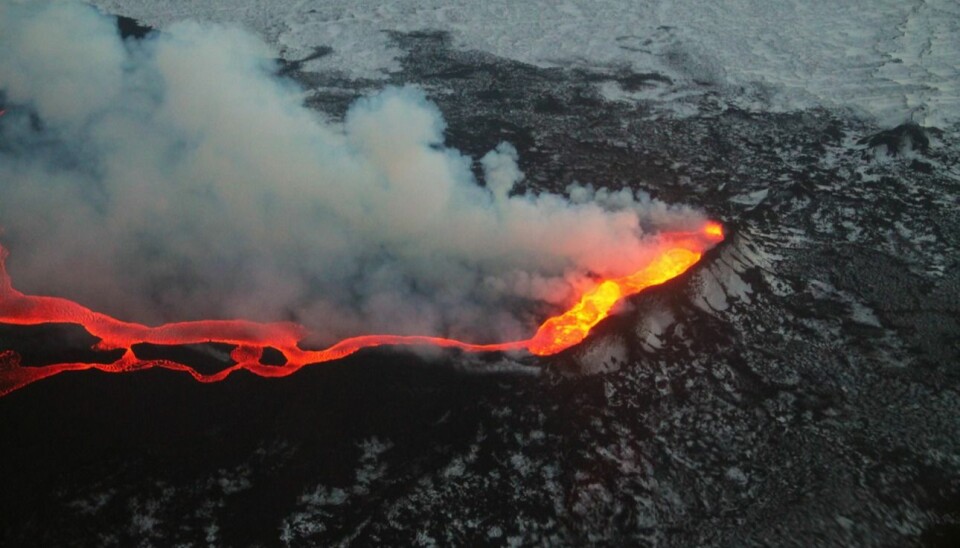
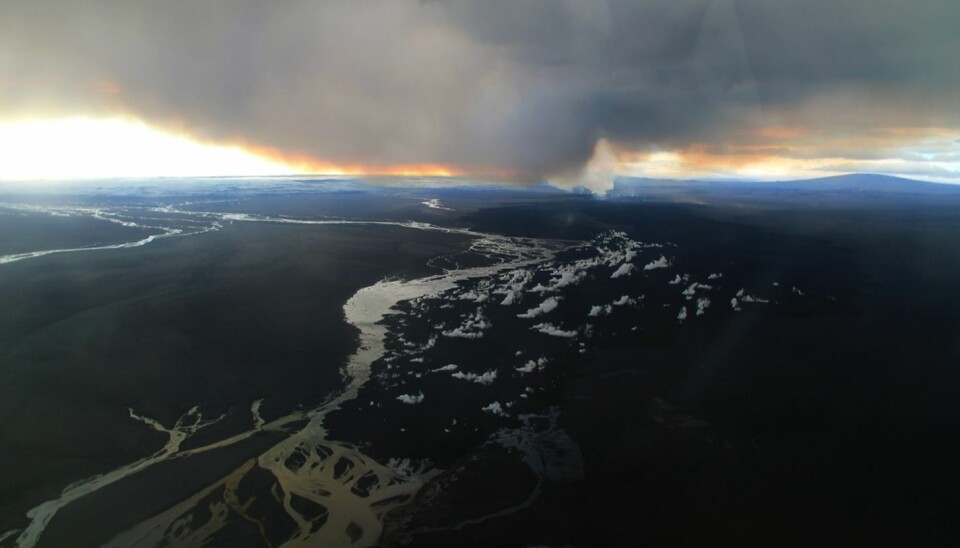
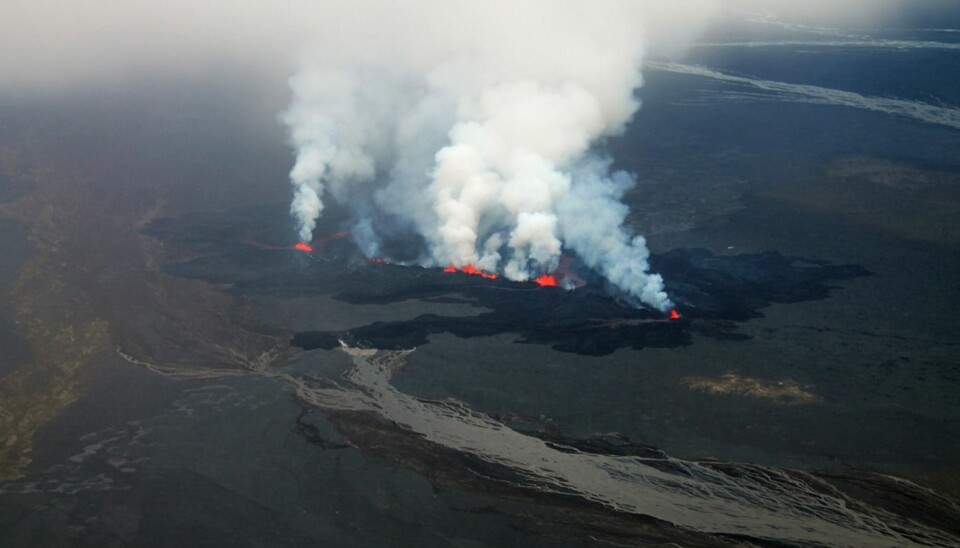
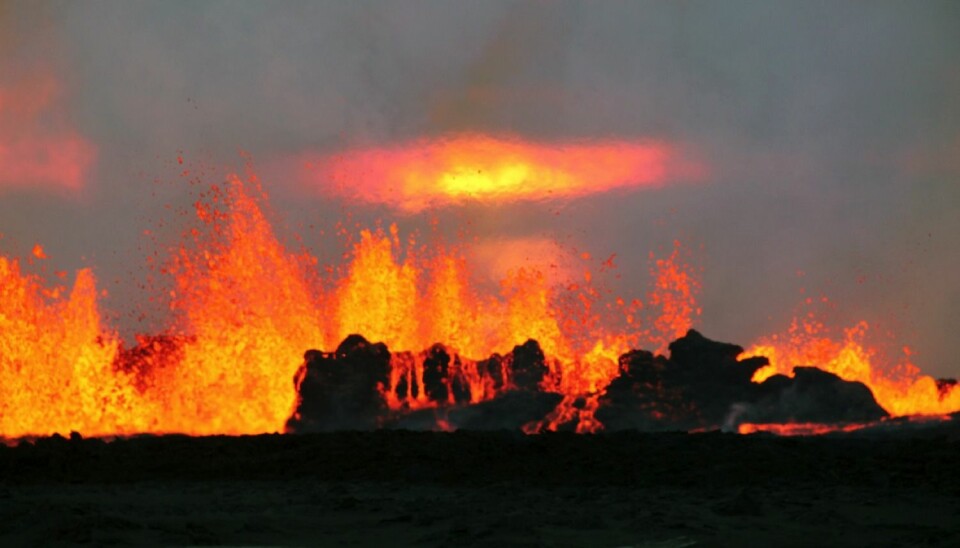
After two weeks, magma finally erupted at the surface at Holuhraun, almost 50 kilometres away from the Bárðarbunga caldera.
See the video below to watch the earthquakes travel away from the caldera.
Answers key questions about volcanic eruptions
Some of the data have been published already, including a description of the path taken by the travelling magma and the chemical composition of the eruption cloud and lava at Holuhraun. But the new model answers some key questions about the sequence of events during volcanic eruptions and in the lead up to a caldera collapse during these large volcanic events.
“We wanted to understand the initiation of the collapse. Is it the magma withdrawl that initiates the collapse, or is it the collapse that triggers the eruption--what comes first? And we show nicely that it is the magma withdrawl that is preceding the collapse,” says Jónsdóttir
Scientists now know for sure that it was the change in pressure caused by the magma exiting the chamber that initiated the caldera collapse. As the eruption continued, the weight above the chamber from the caldera floor and overlaying glacier was too much for it to withstand and eventually the caldera floor began to subside.
“We show how the onset of the caldera collapse was initiated by the withdraw of the magma and how the continued, slow caldera subsidence was controlled by the overlaying burden on the magma reservoir, and the properties of the path that the magma took,” says Jónsdóttir.
“It’s like a plumbing system. You have a huge balloon filled with magma, and then you have something pushing down on it--the roof of the caldera and the glacier above it--and then you have a pipe that is leaking, and slowly the magma drains away,” she says.
Colleague: impressed with the new model
Professor Bob White, from the Department of Earth Science, University of Cambridge, UK, is a member of the FutureVolc project and has published some of the early data from the eruption, including a description of the path taken by the magma from Bárðarbunga to Holuhraun.
He agrees that the new dataset is the largest ever collected during a volcanic eruption and caldera collapse, and that the results further improve our understanding of caldera collapse and of large eruptions in Iceland in general.
“This is a good study of caldera collapse using modern geophysical equipment,” says White, who was not involved in the new study himself.
How do you pronounce Bárdarbunga?
When will it blow again?
White emailed ScienceNordic from the field, where he and his team of geophysicists are busy monitoring the old eruption site.
“We are currently in Iceland driving in to the eruption location in Holuhraun to download seismic data from an array of 70 seismometers that Cambridge have deployed around Bárðarbunga and Holuhraun,” says White.
“They’ve been recording for the past year, but we can only get into this remote area during two months in the summer to download the data recorded over the previous year,” he says, and adds that Bárðarbunga is once again showing signs of activity.
Jónsdóttir agrees.
“We think that the magma chamber is filling up again. We see both deformation signals and a lot of seismicity and the roof of the magma chamber seems to be slowly lifting again. But if this means that we’re going to see the next eruption in one or two years or 100 or 200 years, we don’t know!” she says.
“It’s definitely very active and it seems to be getting ready for the next eruption. We just don’t know when that could be.”
Watch the earthquakes travel from Bárðarbunga to Holuhraun (Video: University of Cambridge Volcano Seismology Group)
Scientific links
- Gradual caldera collapse at Bárdarbunga volcano, Iceland, regulated by lateral magma outflow. DOI: 10.1126/science.aaf8988
- Environmental pressure from the 2014–15 eruption of Bárðarbunga volcano, Iceland. Doi: 10.7185/geochemlet.1509
- Strike-slip faulting during the 2014 Bárðarbunga-Holuhraun dike intrusion, central Iceland. DOI 10.1002/2015GL067423
