Average Danish household has fifth highest carbon footprint in Europe
Why is that, and how do we change it?
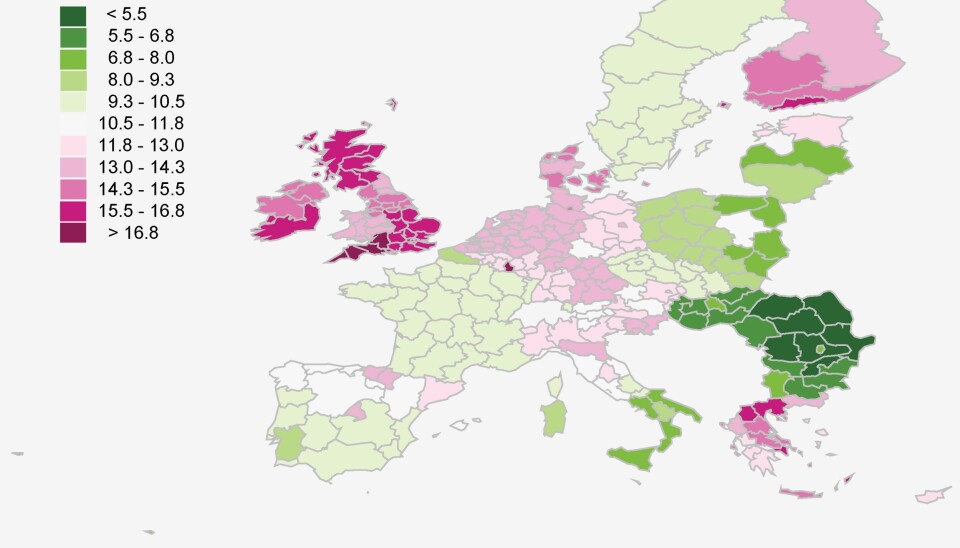
A study published earlier this year reveals the average carbon footprint for households in EU countries, and the news is not good for those of us in Denmark.
The study ranks the average Danish household as having the fifth highest footprint. Placing it behind Luxembourg, the UK, Ireland, and Finland, but ahead of Germany, Italy, and France.
“Denmark’s regions have relatively higher carbon footprints compared to the EU average, which is 11.5 tons CO2. The Danish average is 14.5 tons CO2 so it’s about 20 per cent higher,” says lead-author Diana Ivanova, from Norwegian University of Science and Technology (NTNU), Trondheim.
Denmark was recently ranked top among countries around the world best prepared to face the challenges of climate change. And the results may come as a surprise to many in the country who are proud of their reputation for biking and developments in renewable energy.

Read More: Denmark ranked best in the world to cope with climate change (in Danish only)
Explore the interactive map above to see how the average household's carbon footprint varries around Denmark. Scroll down for more maps at the end of this article. (Data: Ivanova et al., 2017.)
Richest countries have highest carbon footprint
While Denmark’s total carbon footprint was relatively low compared to other EU countries, the results per household suggests that we, as individuals, may be consuming more carbon than we think.
And we are not alone. Overall, it is the richest countries whose households tend to have the largest footprint, says Ivanova.
“We could hypothesise based on our regression analysis that income is an important factor, and relative to other regions, Danish regions are among the richest,” she says.
Read More: The drivers of economic growth in Europe
Low income inequality reflected in carbon footprint
The results do not come as a surprise to Dr Glen Peters, an expert in assessing carbon emissions and consumption at the CICERO Center for International Climate Research in Norway. He describes the study as “useful” and one that “we can learn a lot from.”
“Income is always a strong explanation for differences. The more money you have the higher your emissions,” he writes in an email to ScienceNordic.
Not only that, but as income inequality is relatively low across Denmark, this too is reflected in the carbon footprint.
“Income is very similar across Denmark. This is quite different to other countries where the capital region really stands out with much higher incomes and higher consumption, but we don’t really see it in Denmark,” says Ivanova.
Read More: Calculating the environmental footprint of governments
Copenhagen biking city produces low fuel emissions
But before you decide to give up your daily commute by bike in the frustration that it apparently has not made any difference to your carbon footprint, the new data has some good news, says Ivanova.
“In urban areas, such as Copenhagen, we actually see lower emissions from commuting than the rest of Denmark. That’s lower fuel use and lower emissions and lower consumption, so overall the land mobility is much lower,” says Ivanova.
“So that’s actually very good! Copenhagen has an image of a biking city and we can see that in the data,” she says.
Read More: Cycle like the Scandinavians for a healthier society
High emissions from food
The study not only considers the average and total carbon footprint per country, it also looks at the regions within each country, and traces the sources of their carbon emissions. This is done by surveys of individual household consumption and analyses of supply chains to those regions.
This allowed Ivanova and colleagues to report the emissions for each region associated with a number of categories of consumption, including food, housing, transport, and fuel.
Viewed in this way, Denmark appears to have relatively high emissions associated with food, manufactured products including furniture, and fuel for transport.
“This could be to do with diet. Higher emissions are associated with processed food, which are very energy intensive to produce, such as frozen pizzas. But it could also reflect high meat consumption and animal products in general,” says Ivanova.
But this is where we as individuals can have a big impact on the carbon footprint where we live, she says.
“Twenty-seven per cent of Copenhagen’s footprint is associated with food. So changing the diet or reducing food waste, which Denmark is famous for, could really reduce environmental pressure,” says Ivanova.
Read More: 3D-model of cream cheese can reduce food waste
Eat less meat and buy second-hand
Dr Afton Halloran recently completed a Ph.D. at the University of Copenhagen, Denmark, which investigated the environmental impact of animal source food consumption around the world.
She agrees with Ivanova.
“Food is always a great place to start when it comes to reducing the environmental footprint of our households. Denmark had made a lot of headway to reduce household food waste, but there is still a lot of work to do,” she says.
We can also reduce our footprint by changing other consumer habits, such as splashing the cash on an exercise class rather than a new TV, or buying second-hand furniture instead of purchasing it brand new.
Read More: How much more environmentally friendly is it to eat insects?
Regions can do more to reduce national emissions
But it is not only up to us as individuals to change our consumer habits, says Ivanova.
Mapping the carbon footprint for individual regions within a country should also help EU member states to reduce emissions more effectively by identifying where emission cuts would have the biggest impact.
“Local authorities have a lot of power, and the EU is encouraging them to implement environmental policies, but they can’t do this if they don’t have an overview of their consumption-based emissions,” says Ivanova.
Read more: How to nudge consumers to make greener choices
Some changes have to come from regional or national governments, such as investments in green infrastructure or policies to make our homes more energy efficient, she says.
The study raises some important questions for us to think about going forward, says Peters.
“Should we strive to work less, earn less, etc? Or should we focus on technological solutions to emissions so we can consume what we want? The study does not need to answer these questions, but doing such a study allows you to ask them. This is why I would say it is an important study,” he says.
Scroll down to explore more intereactive maps of Denmark's carbon footprint.